
Since the previous research note · Earlier expectation not tested
Track continuity
Since the previous research note: How nitrogen changes a chloride solid for battery ion transport
Previous expectation: Nitrogen-driven changes in chloride electrolytes could broaden the materials available for durable solid-state batteries if their transport properties survive practical integration and scalable production.
What this study adds: This study adds a measurement perspective, comparing neutron probes of buried lithium–LiPON interfaces and showing how preparation and length scale affect their interpretation. It does not test nitrogen-modified chlorides or the earlier forecast about their integration and production.
What changed in this study
A solid-state lithium-metal battery has an interface that is important precisely because it is difficult to see. Lithium metal and a solid electrolyte meet inside a sealed stack, and the region between them may not be a clean, abrupt boundary. It can instead be a transition layer, or interphase, in which material properties change across a small distance.
A non-peer-reviewed preprint dated December 6, 2025, reports a study of a model contact between lithium metal and lithium phosphorus oxynitride, known as LiPON. The researchers compare two neutron-based ways to investigate that buried region. The result appears contradictory at first. Neutron depth profiling did not resolve a distinct interphase, while neutron reflectometry indicated thin, graded regions. The difference is less a contest between right and wrong answers than a reminder that each measurement turns the hidden contact into a different kind of evidence.
Two measurements ask different questions
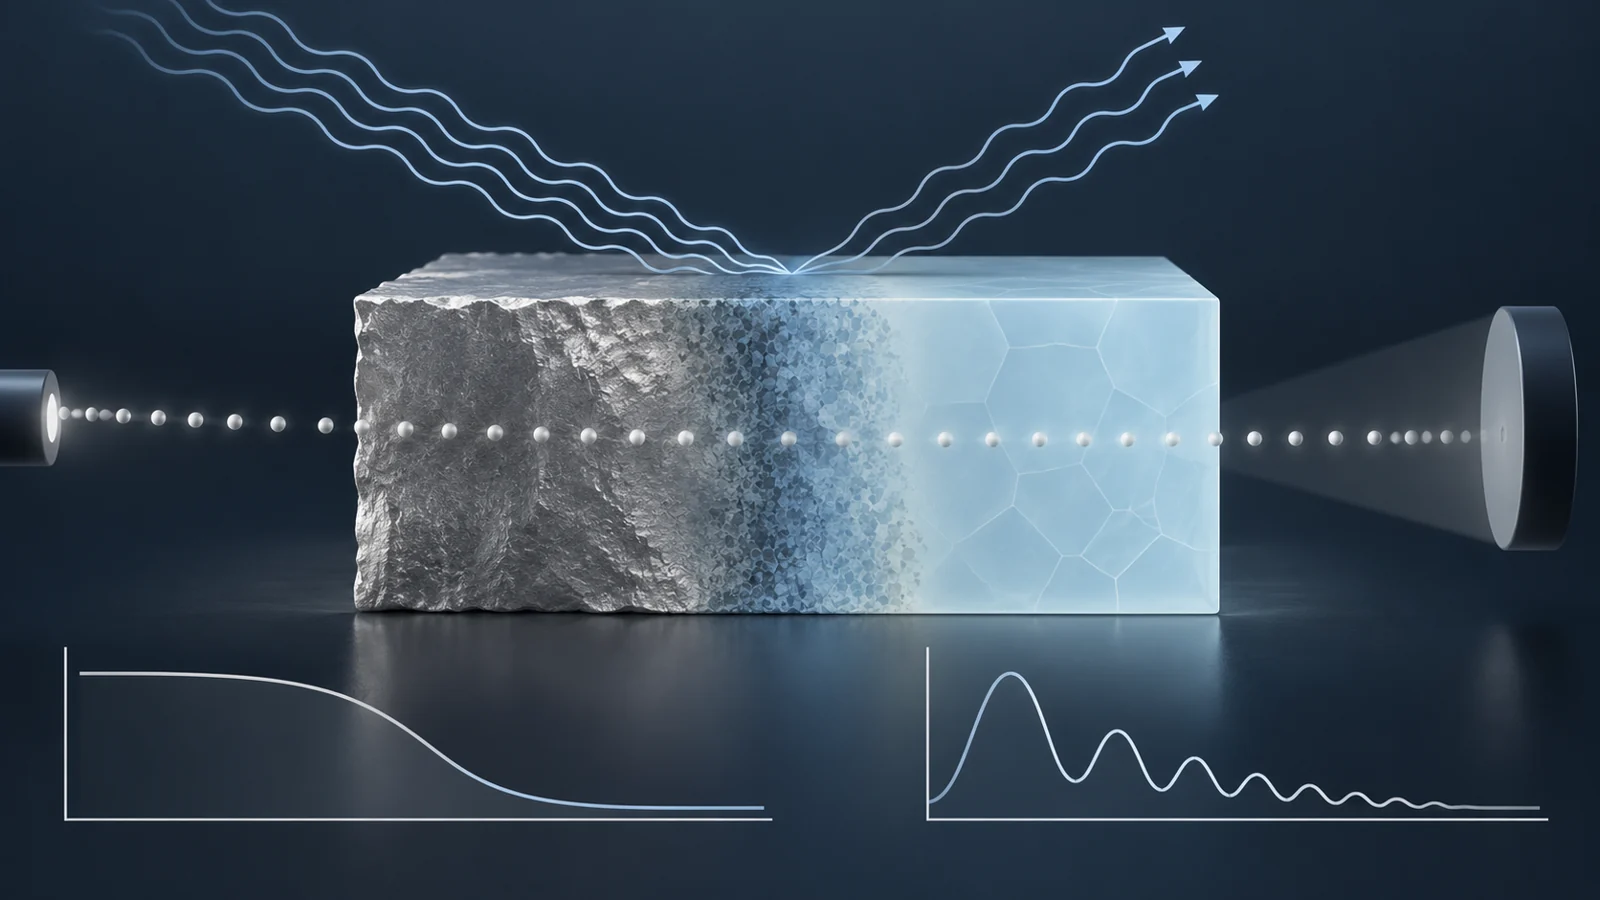
Neutron depth profiling and neutron reflectometry both use neutrons, but they do not observe the interface in the same way.
In depth profiling, neutrons interact within the sample and produce emitted particles. The particles lose energy as they travel through material before reaching the detector. Their measured energy can therefore be used to infer where along the depth direction the relevant interactions occurred. The result is a depth-sensitive profile, not a photograph of the boundary.
Reflectometry takes another route. Neutrons are directed at the layered sample, and the reflected intensity is measured as a function of angle or momentum transfer. Researchers then fit that reflection pattern with a model of the layers, including quantities related to thickness, roughness and neutron scattering contrast. A graded interphase may be the profile that best explains the pattern, but it remains a fitted interpretation of the measurement rather than a directly imaged strip of material.
That distinction helps explain how the two techniques can describe the same buried contact differently. A feature may influence a reflection pattern enough to support a thin gradient in the fitted model while failing to produce a separate, resolvable feature in a depth profile. The absence of a distinct depth-profiling feature therefore cannot establish that the interphase is absent.
The techniques also examine a relatively large area and penetrate beneath the surface. That makes them useful for a sealed interface that would be difficult to study with a method requiring direct exposure, while also making the measured result an average over the specimen rather than a view of one microscopic location.
The fabricated samples gave a split result
The researchers prepared model LiPON–lithium samples using more than one deposition approach and compared the interfaces with both neutron methods. In the depth-profiling data, they did not observe a distinct interphase at the contact. Reflectometry, however, distinguished differences between interfaces made using electrodeposition and vapor deposition and described both as graded interphases less than a few tens of nanometres thick.
This result makes preparation part of the interpretation. Changing how the layers are deposited changes the fitted response seen by reflectometry, so two contacts built from the same named materials need not produce identical measurements. The study does not rank either deposition route by battery performance; its comparison is about what the neutron data reveal about the prepared interfaces.
The thickness estimate is best read as a result for these model specimens, not as a universal specification for lithium–solid-electrolyte contacts. More importantly, the two measurements do not produce interchangeable descriptions. Depth profiling did not separate a narrow feature in its profile, while reflectometry found that a graded transition gave a useful account of the reflection pattern.
Simulations show where each method is sensitive
The study also used simulations to test what the methods might detect under controlled conditions. In a model consisting of LiPON, lithium oxide and lithium, the researchers inserted lithium-oxide layers of different thicknesses and examined how those layers would affect the measurements.
These simulations test instrument sensitivity. They ask whether a layer with a chosen thickness and assumed contrast would leave a detectable signature under the measurement conditions. They are separate from the experimental finding about the fabricated interfaces, so the inserted lithium oxide should not be treated as an identification of the graded interphase observed by reflectometry.
The comparison points to complementary length scales. Reflectometry is particularly useful for detecting thin interphases, while depth profiling may be better suited to thicker regions. The source’s simulations and discussion place the techniques in different useful ranges, but those ranges depend on the specimen and measurement setup rather than functioning as one fixed specification for every experiment.
Reflectometry is especially sensitive to the thin-layer problem, yet its interpretation becomes harder when the film stack is too thick or the surface is rough. The study notes that high-quality data generally require relatively thin stacks, with the practical limit depending on the sample. Depth profiling can add information across greater depths and may be more informative when a transition extends beyond the thin-interphase regime, even though a narrow separate layer can blend into its surrounding signal.
Together, the methods cover more of the measurement problem than either one alone. Reflectometry can test whether a thin gradient is needed to fit the reflection data. Depth profiling can provide a different depth-sensitive view of thicker structures. Agreement between the methods would strengthen an interpretation, while a difference can reveal that the interface is being sampled at mismatched scales.
A new material needs the right specimen
Applying this approach to another solid electrolyte would require more than replacing LiPON with a different name. Reflectometry depends on a sample geometry that produces interpretable reflection patterns. Surface and buried-interface roughness can blur the distinction between adjacent layers, and the total film thickness affects the quality of the data.
Chemical interpretation brings another constraint. Reflectometry’s chemical sensitivity is mediated through fitted scattering-length-density values and the contrast between neighboring materials. If possible compositions produce similar contrast, the measurement may constrain the structure without uniquely identifying the chemistry. A fitted transition is therefore not automatically proof of a particular compound.
Depth profiling has its own sample requirements and depth range. A contact that is thin relative to the method’s resolving power may blend into the surrounding signal, while a thicker region may be easier to distinguish. The most informative experimental design may therefore use specimens suited to each technique rather than treating one sample geometry as universally optimal.
That is why the LiPON system is useful as a model contact, but not as a complete stand-in for an operating battery. The measurements show how a buried interface can be interrogated and how preparation affects its interpretation. Linking such a profile to charging behavior, cell lifetime or performance across other solid-electrolyte chemistries would require further evidence connecting interface structure with electrochemical behavior.
What this could change
If researchers can extend these complementary measurements to a wider set of solid electrolytes and connect the resulting interface profiles with electrochemical behavior, they could design contact-forming processes with a clearer understanding of what happens beneath the surface. Instead of judging a lithium–electrolyte contact only by how it was fabricated or by a single fitted signal, engineers could compare how its graded region forms, how stable that region remains and which structural features accompany useful operation.
That capability could eventually support more durable solid-state lithium-metal cells by helping researchers preserve effective contact between lithium and the electrolyte during use. The benefit is conditional: it depends on measurements that remain interpretable in relevant materials and on a demonstrated connection between buried-interface structure and cell behavior. This study establishes a measurement perspective for that work, not a battery-performance result.
Key Sources
- Primary source: Measuring the buried interphase between solid electrolytes and lithium metal using neutrons
arXiv · Preprint · 2025-12-06