
Since the previous research note · Earlier expectation not tested
Track continuity
Since the previous research note: When sodium moves, the battery contact moves with it
Previous expectation: Predictive models of changing sodium contact could eventually help developers preserve interfaces through repeated sodium removal and deposition.
What this study adds: Controlled experiments at an electrode/Li6PS5Cl interface quantify how contact geometry and pressure affect resistance, with continuum simulations reproducing the geometry-dependent trend. This adds an electrical consequence of contact arrangement without testing the earlier forecast about sodium contact evolution.
What changed in this study
A solid-state battery interface can have the same total area of contact and still offer very different opposition to charge transport. The reason is that where surfaces touch matters, not only how much they touch.
A December 2024 preprint, Constriction and contact impedance of ceramic solid electrolytes, investigates this distinction at an electrode/Li₆PS₅Cl interface. The study combines controlled contact geometries, applied pressure and continuum simulations to examine how contact loss changes interfacial resistance. Its central comparison is simple: hold the total contact area constant, rearrange it, and see what changes.
The same area can create different bottlenecks
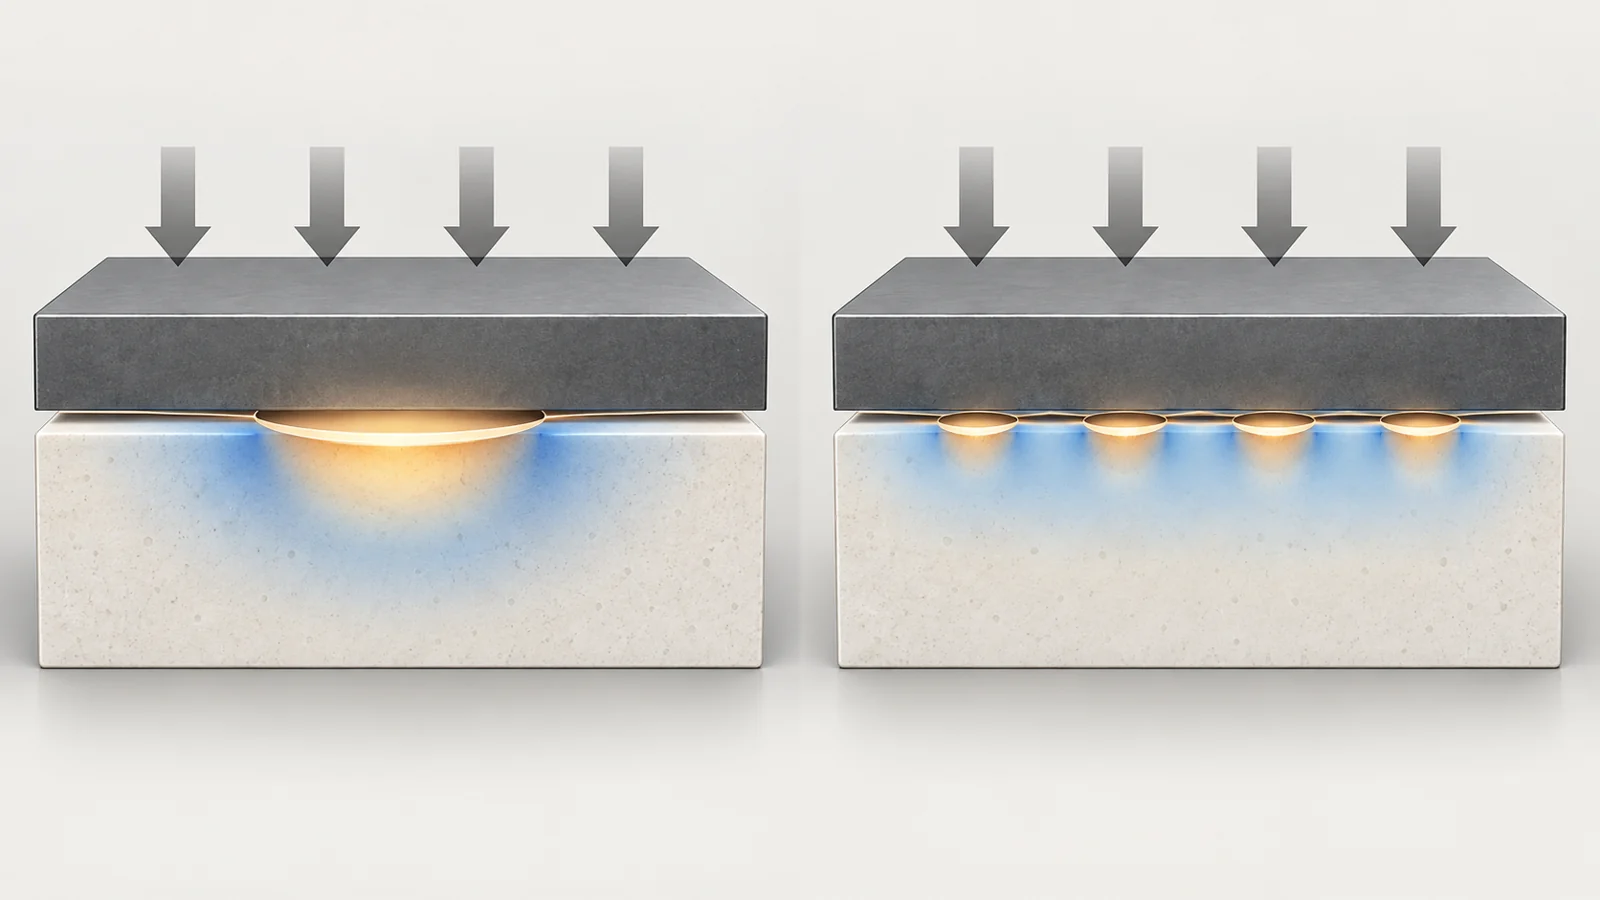
The experiments compared three arrangements. One used a single circular contact with a diameter of 5.9 millimetres. The others divided the same total contact area into several smaller regions: four contacts measuring 2.95 millimetres each, and a more distributed arrangement combining three 2.90-millimetre contacts with four smaller 1.55-millimetre contacts. Measurements were made at 180, 225 and 270 MPa.
At 270 MPa, the analysis separated the resistance of the ceramic bulk from the resistance associated with the interface. The bulk resistance remained constant across the contact arrangements. Interfacial resistance, by contrast, fell as the contacts became more distributed.
That separation is important because it places the observed difference at the boundary between materials rather than in the ceramic electrolyte as a whole. The total amount of contact was held steady, but the route into and across that contact was changed. In this experiment, layout altered the interface’s electrical difficulty even when the nominal area did not.
Pressure and contact area follow different patterns
The preprint also distinguishes changing the contact area from pressing the materials together more strongly. The reported interfacial resistance followed a power-law relationship with recoverable contact area, with an exponent of −1. Within the studied conditions, that corresponds to an inverse relationship: a twofold increase in the relevant contact area would be associated with roughly half the interfacial resistance if the same scaling continued across that comparison.
Applied pressure showed a different exponent, −0.5. In plain terms, resistance changed with the inverse square root of pressure rather than in direct inverse proportion. A twofold pressure increase would therefore correspond to a reduction by about the square root of two under that relationship, assuming the other conditions remained comparable.
These exponents are useful because they show that “press harder” and “create more effective contact” are not interchangeable instructions. They affect the interface through different reported scaling responses. The relationships describe the experimental range and configuration; they are not universal laws for every pressure, contact size, electrode or solid electrolyte.
Why contact arrangement changes the electrical path
The physical explanation is constriction. When transport is forced through limited contact regions, charge flow is funnelled into narrower routes. That can create stronger spatial changes in electrical potential near the interface, increasing the resistance associated with crossing it.
Distributing the same total contact area changes that pattern. Instead of concentrating the route through one region, several contacts can create a more even potential distribution and smaller potential gradients. The result is not simply “more area.” It is a different spatial arrangement of the electrical field across the boundary.
The continuum simulations reproduced the direction of the experimental trend. For the equal-area geometries, both measured and simulated total resistance decreased as the contacts became more distributed. The agreement supports the proposed connection between contact geometry, potential distribution and interfacial resistance in this setup. It does not establish that every evolving battery interface will respond identically.
The result belongs to a controlled interface
The tested material and loading conditions matter. The measurements concern an electrode/Li₆PS₅Cl interface, with comparisons made at pressures of 180, 225 and 270 MPa. The experiment isolates geometry and pressure in a way that makes their effects easier to distinguish than they would be in a complete working cell.
A lower interfacial resistance in this arrangement is therefore not the same as a demonstrated improvement in full-cell power, charging speed, energy density, safety or service life. A practical cell would need to create a useful contact distribution, keep it in place while the battery operates, and maintain the relevant behavior under its own materials, forces and changing interface conditions. Those steps require a further connection between a controlled interface measurement and an operating battery.
The study also addresses the electrical consequence of arranging contact. These geometry comparisons do not establish whether a model can predict and control how contact evolves during repeated material removal and deposition. That is a separate question from how a given geometry affects resistance once it is established.
What this could change
If useful contact distributions can be created and retained under operating conditions, interface design could become a way to reduce resistive losses in solid-state batteries. Less opposition at the ceramic boundary could mean less voltage lost while charge passes through it, potentially helping a cell deliver power with less of its available voltage consumed by the interface.
That possibility depends on both parts of the result holding together in practice: the geometry must produce the favorable electrical pattern, and the interface must preserve that geometry at practical pressures during operation. The December 2024 preprint supplies a measured geometry-to-resistance relationship and a matching continuum explanation. Turning that relationship into a cell-level benefit remains conditional on making the contact arrangement durable and transferable beyond the tested interface.
Key Sources
- Primary source: Constriction and contact impedance of ceramic solid electrolytes
arXiv · Preprint · 2024-12-31