
Evidence date · 2025-09-30 · Research note 2 of 2
1 2
See current Track status →
Since the previous research note · Partly supported
Track continuity
Since the previous research note: How earlier sleep quality and sleep hours related to the aging brain
Previous expectation: Sleep care might eventually be tailored across adulthood to preserve brain tissue if sleep-related processes prove modifiable and improving sleep changes later brain outcomes.
What this study adds: The 2025 UK Biobank study adds a large prospective association between a combined sleep score and subsequent MRI-derived brain age, alongside an inflammation mediation analysis and a supported sex interaction. It does not test improved sleep as an intervention or establish the best life stage for treatment.
What changed in this study
A brain scan can produce an age estimate that differs from a person’s actual age. In a September 30, 2025 study, people with fewer healthy sleep characteristics tended to have a larger gap between those two estimates when their brains were scanned years later. The researchers also examined whether low-grade systemic inflammation might statistically account for part of that relationship.
The finding is important because it connects an overall pattern of sleep with a later MRI-based measure of brain structure and function. It is not, however, a diagnosis of dementia or proof that poor sleep caused the brain to age faster. The study shows how these measures traveled together in a large observational group, and it offers a possible biological link that needs further testing.
What the study measured across nine years
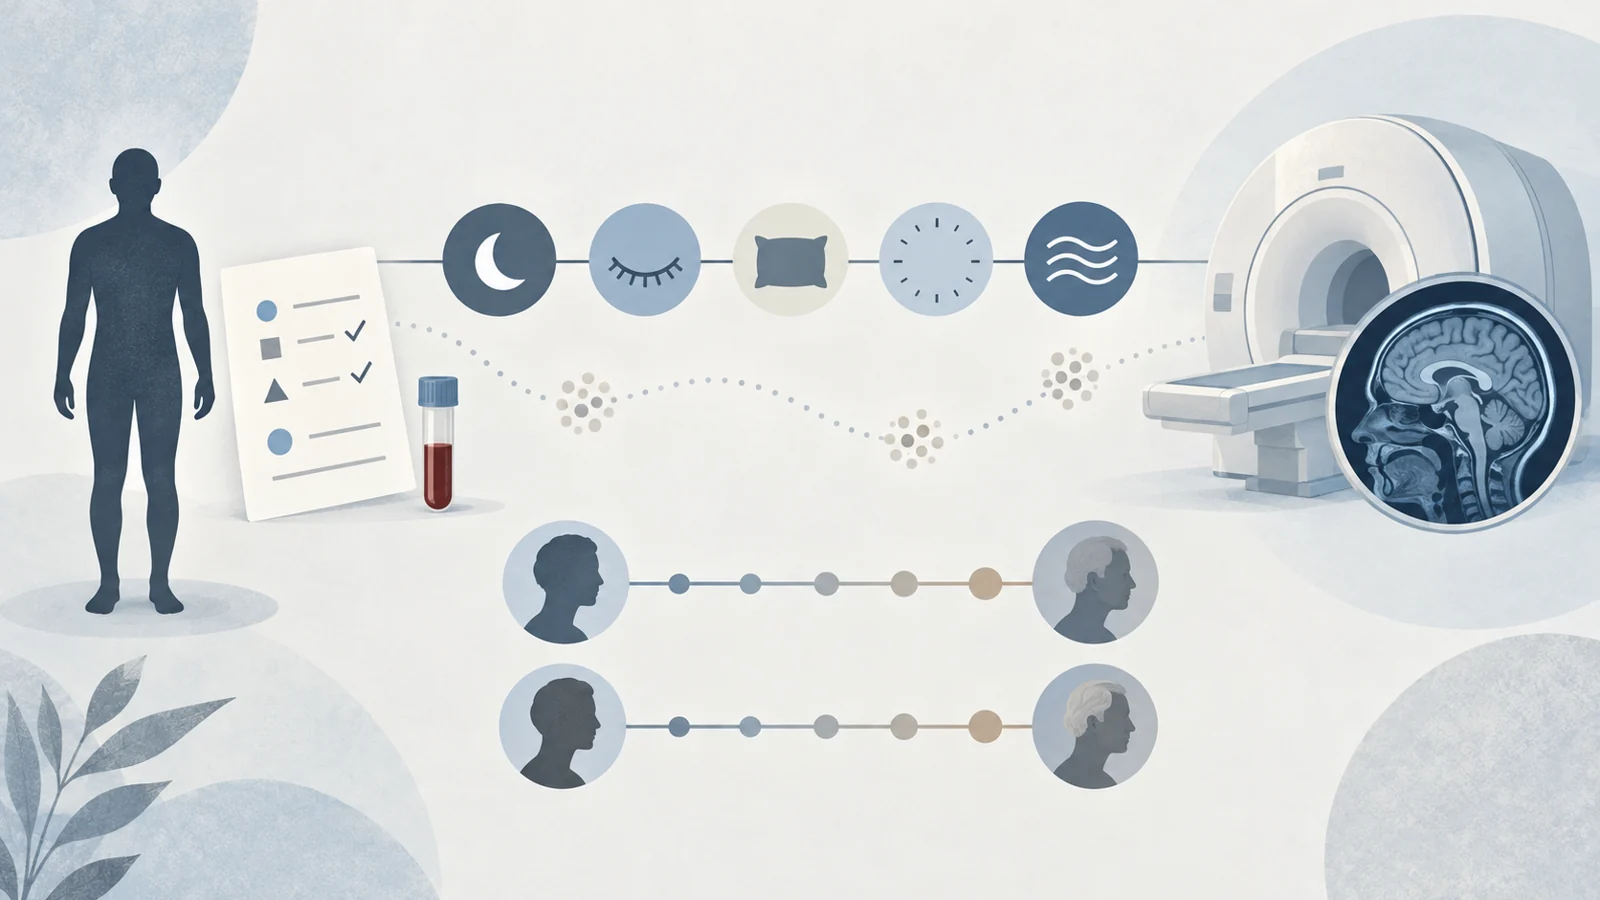
The analysis used 27,500 adults from the UK Biobank. At the initial assessment, conducted between 2006 and 2010, participants answered questions about their sleep and provided blood samples. A later MRI assessment took place between 2014 and 2020, a mean of 8.9 years after baseline.
The researchers represented sleep health with a five-point score. Participants received one point for each of five characteristics: being an early chronotype, usually sleeping seven to eight hours per day, reporting no insomnia, reporting no snoring, and reporting infrequent excessive daytime sleepiness. The questions referred to how participants had slept over the previous month.
This score was an operational definition created for the study. It was not presented as a personal prescription or a validated risk calculator. A score of four or five counted as a healthy sleep pattern, two or three as intermediate, and zero or one as poor. The study included 11,319 people in the healthy group, 15,283 in the intermediate group, and 898 in the poor group.
That distribution also matters for interpretation. The poor-sleep category was much smaller than the intermediate category, so its estimate came from fewer people. The investigators adjusted their statistical models for factors including age, sex, education, race, socioeconomic status, lifestyle measures, and cardiometabolic disease, but adjustment cannot make the groups equivalent in every relevant way.
How an MRI becomes a brain age gap
The researchers did not read a single scan and assign an ordinary clinical age. They used a machine-learning model that combined 1,079 measurements derived from several MRI modalities. These included measures related to brain tissue, white matter, connectivity, and other scan features. A subset of healthy participants was used to train and validate candidate models, and the best-performing approach was then used to estimate brain age for participants with complete data.
Brain age was the age predicted from the MRI measurements. The brain age gap, or BAG, was calculated by subtracting chronological age at the time of the MRI from that predicted age. A positive value means the predicted brain age was older than expected relative to the person’s chronological age; a negative value means it was younger than expected.
This makes the measure easier to understand, but it also sets a boundary around what it means. A brain age gap is a statistical difference between an estimate and a person’s actual age at one assessment. It is not a measured annual aging rate. A positive gap is not the same as a dementia diagnosis, and it does not mean that a person has lost a corresponding amount of cognitive ability or life expectancy.
The size of the association depends on the comparison
In the full-text results, each one-point decrease in the healthy sleep score was associated with a 0.48-year greater brain age gap after the study’s adjustments. The result describes a change in the estimated gap across the score, not a prediction that one sleep habit adds a fixed number of years to an individual’s brain.
The categorical results provide another comparison. The average brain age gap was approximately 0.26 years in the healthy sleep group, 0.62 years in the intermediate group, and 0.99 years in the poor-sleep group. In other words, the 0.99-year figure describes the average difference between estimated brain age and chronological age within the poor-sleep group. It does not represent a one-year difference between poor sleepers and healthy sleepers.
After adjustment, the intermediate group had a higher brain age gap than the healthy group, and the poor group also had a higher gap. The models included a broad set of measured characteristics, which reduces the influence of those particular variables on the comparison. It does not eliminate the possibility that other differences between participants helped produce the pattern.
The timing gives the analysis a prospective structure: sleep information came before the MRI measurement. That is useful because the exposure and the scan were not collected at the same visit. Still, prospective observation alone does not establish the direction of cause. Sleep may influence later brain health, emerging health changes may affect sleep, or both may reflect other conditions.
Where inflammation enters the analysis
Blood samples collected at baseline were used to calculate an INFLA-score, a composite measure of low-grade systemic inflammation. It combined C-reactive protein, white blood cell count, platelet count, and the granulocyte-to-lymphocyte ratio. Each biomarker was placed into deciles, scored from lower to higher levels, and combined into a total ranging from -16 to +16. Higher scores represented greater inflammation within this study’s measurement system.
The researchers then used mediation analysis to ask how much of the statistical association between sleep pattern and brain age gap was consistent with a path through the inflammation score. The estimated mediated proportion was 6.81% for the intermediate-sleep association and 10.42% for the poor-sleep association.
In plain language, the results are compatible with inflammation accounting for a modest part of the relationship between sleep category and the later MRI-based age gap. Most of the association remained outside that modeled pathway. Mediation percentages are not measurements of a biological process unfolding in real time. Sleep and inflammation were assessed at baseline, and the analysis cannot by itself show that sleep changes caused inflammatory changes that then altered the brain. It also cannot establish inflammation as a treatment target.
The inflammation result is therefore best understood as a clue about mechanism rather than a completed chain of cause and effect. It gives researchers a way to investigate whether the sleep–brain relationship reflects partly shared biological processes, while leaving open other explanations.
What the subgroup results add
The association between a lower sleep score and a higher brain age gap was stronger in men than in women in the detailed interaction analysis. That finding concerns a statistical interaction, meaning the researchers tested whether the estimated relationship differed between the groups. It is more informative than simply observing that an association reached statistical significance in one subgroup but not another.
The analysis did not detect a statistically supported interaction across the specified age groups or between APOE ε4 carriers and non-carriers. This does not identify a protected age group, show that the association is stronger below age 60, or establish the best life stage for changing sleep. It indicates that the available data did not provide evidence that the relationship varied in those particular comparisons.
The study also reported similar findings in several sensitivity analyses. These included approaches that addressed missing covariate information, reweighted the sample, excluded people with sleep disorders, adjusted for additional characteristics such as body mass index and MRI assessment center, and excluded participants used in the brain-age model’s training set. Such checks make the central association less dependent on any single modeling choice, but they do not convert an observational result into an experiment.
Why the result needs a careful reading
The UK Biobank is large, but the people who entered its imaging cohort were not a random cross-section of all adults. The study population was described as healthier and more socioeconomically advantaged than the broader UK population. Participation in MRI assessment also involved selection, and the roughly nine-year gap between baseline and scanning means that surviving, remaining healthy enough, and completing imaging could all influence who was analyzed.
The study excluded participants with chronic neurological disorders at the time of MRI and participants with missing sleep information. Those decisions helped define a cleaner analysis, while also narrowing the population to which the results may apply. People who were unable to undergo imaging or who did not remain in the study may have had different sleep, inflammation, or brain-health profiles.
Sleep was self-reported, based on a limited set of questions. Participants living alone, for example, may have had less certain information about snoring, and the questionnaire could not fully capture every aspect of sleep timing or quality. A response about the previous month may also have represented a shorter period of experience than the long interval before MRI assessment.
Most importantly, the study compared naturally occurring differences between people rather than assigning sleep conditions or improving sleep experimentally. A poorer sleep pattern could contribute to a later older-looking brain, but the data do not prove that sequence. Nor do they show that improving sleep would reverse a brain age gap, prevent dementia, or produce a measurable cognitive benefit. The MRI estimate is a useful research measure, not a stand-alone screening result that determines an individual’s future.
What this could mean for preserving brain health
For adults approaching older age, the potential practical benefit is conditional but meaningful. Effective sleep care might eventually become one way to help preserve brain and cognitive health if intervention studies show that improving sleep changes later brain outcomes and that those changes translate into meaningful everyday function.
The inflammation finding could help researchers understand which biological processes accompany the sleep–brain relationship and whether they are modifiable. It does not yet justify an anti-inflammatory treatment for sleep-related brain aging. The next advance would come from showing that changing sleep changes the relevant brain and functional outcomes, not simply from finding a larger association between sleep scores, blood markers, and MRI estimates.
Key Sources
- Primary source: Poor sleep health is associated with older brain age: the role of systemic inflammation.
DOI or Journal Page · Peer-Reviewed Paper · 2025-09-30