
Research Signal – Source date 2026-03-01
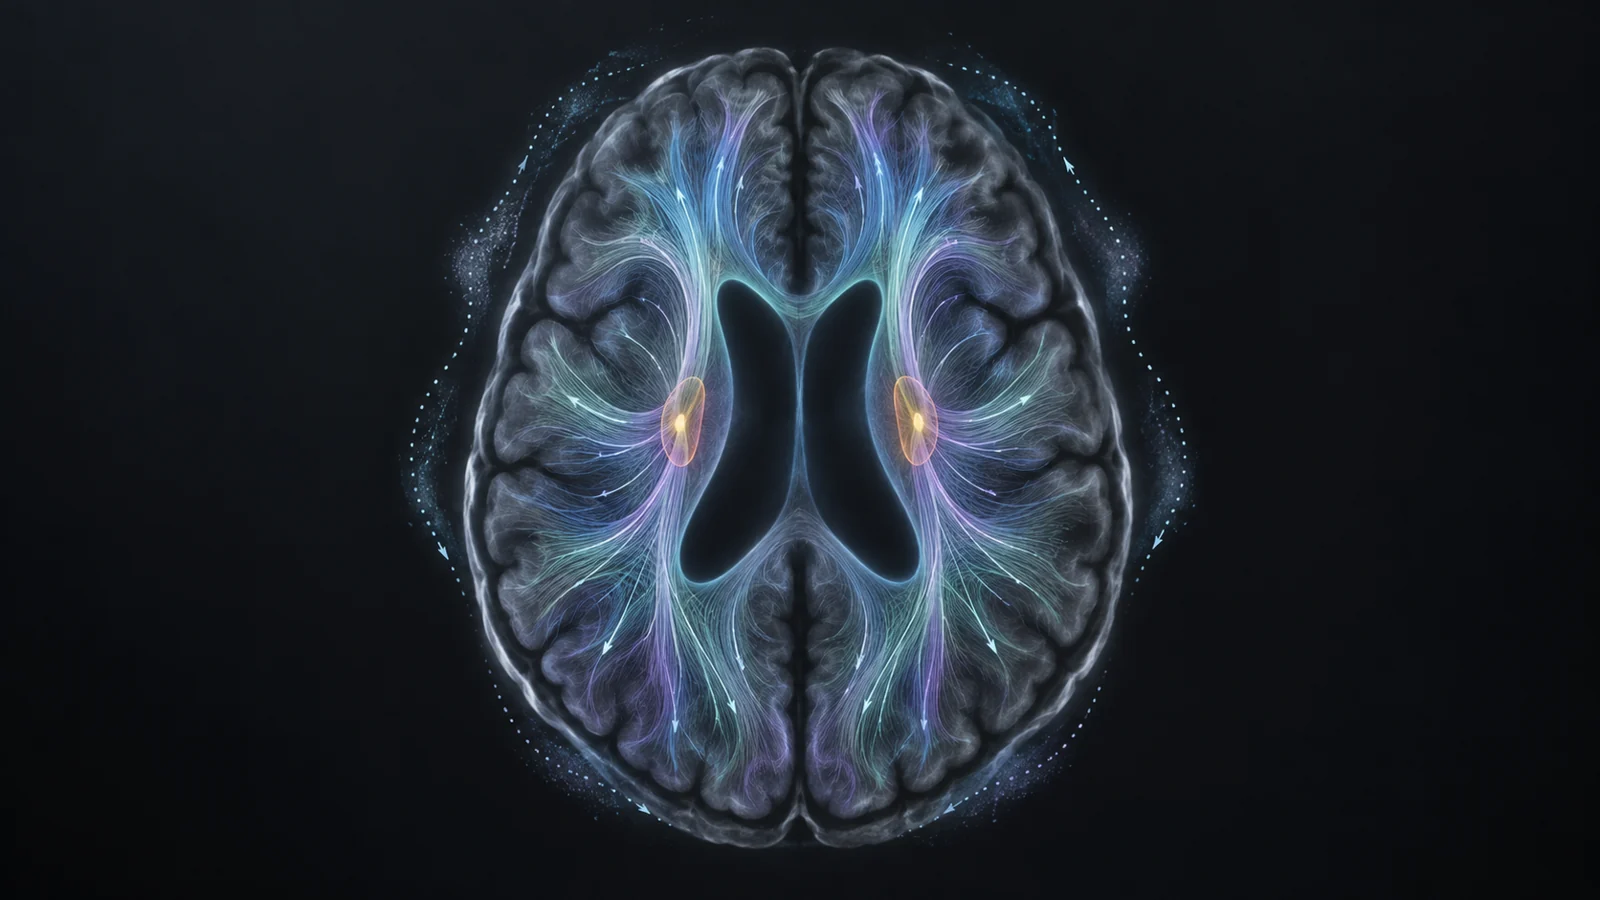
A brain scan can show water moving more readily in some directions than others. A new formula called G-ALPS uses those directional measurements to produce a score that tracked several measures of cognitive difficulty somewhat more closely than the established ALPS score in one research analysis. The improvement was modest, and it answers a narrower question than the phrase “brain waste clearance” might suggest.
The study compared scores calculated from diffusion tensor imaging (DTI), an MRI method that measures the directionality of water movement in tissue. It did not directly observe fluid clearing waste from the brain. The authors propose G-ALPS as an indirect index that may reflect glymphatic function—the brain’s proposed pathway for exchanging fluid and clearing waste—but the score is also shaped by nearby white-matter tissue and imaging choices.
A new formula for directional diffusion measurements
The classic ALPS index uses diffusion measurements near the lateral ventricles, fluid-filled spaces within the brain. In selected regions, projection and association fibers run in orientations that can be compared with the direction of nearby perivascular spaces. The index combines directional measurements to estimate how much diffusion runs along versus across those orientations.
G-ALPS uses the same kinds of measurements but rearranges them into a different formula. Its numerator adds x-direction diffusion in projection and association fibers, then subtracts y-direction diffusion in projection fibers; the result is divided by z-direction diffusion in association fibers. The x-direction measurements are treated as parallel to nearby perivascular spaces; the other components reflect diffusion across fiber orientations.
The formula was not chosen independently of human outcomes. The researchers used genetic programming, a computational search method, to find a formula whose scores correlated with Mini-Mental State Examination (MMSE) and Clinical Dementia Rating (CDR) scores. MMSE is a measure of cognitive performance, while CDR assesses impairment, including its functional effects. The team then compared the resulting G-ALPS score with the standard ALPS index.
How the comparison was set up
The analysis drew on 217 imaging samples: 150 from the Alzheimer’s Disease Neuroimaging Initiative (ADNI) and 67 from the Human Connectome Project (HCP). The researchers used 100 ADNI samples to develop the G-ALPS formula. They evaluated it on 50 other ADNI samples and on the 67 HCP samples.
Holding those 50 ADNI samples out of formula development matters: it gives a check on whether the observed relationships also appear in data that did not guide the formula’s selection. The HCP analysis adds a separate dataset and different measures, including sleep quality. Neither comparison, however, is a demonstration of performance in a new clinical service or across a broad range of clinical populations and scanners.
The study also used repeated ADNI scans for a separate aging analysis. That part included 88 scans from 28 people—7 with Alzheimer’s disease, 9 with mild cognitive impairment, and 12 normal controls—who had more than two scans at distinct months or years. These repeated observations were used to examine how each score changed with age; they were not a further independent test group.
Cognitive links improved by small amounts
In the 50 held-out ADNI samples, G-ALPS had slightly stronger correlations than ALPS with all three reported measures. Its correlation with MMSE was 0.37, compared with 0.36 for ALPS. For CDR, the correlations were −0.41 and −0.39; for the Functional Activities Questionnaire (FAQ), which measures difficulty with everyday activities, they were −0.44 and −0.40.
The paper describes those changes as improvements of 2.78% for MMSE, 5.13% for CDR and 10% for FAQ. These percentages refer to the relative change in the correlation coefficient, not a percentage increase in accuracy or in patients’ cognitive performance. The direction of the associations is consistent with higher G-ALPS values accompanying better MMSE scores and lower reported impairment on CDR and FAQ.
The individual G-ALPS correlations in this test set were statistically significant after the authors’ correction for multiple comparisons. That does not by itself show that the difference between G-ALPS and ALPS is statistically significant. Nor do correlations establish that either score can diagnose a person, predict an individual’s decline, or improve care. They show how two calculated imaging scores related to assessment results in these samples.
Repeated scans showed steeper age-related slopes
Among participants with repeated scans, G-ALPS showed a steeper age-related decline in the reported groups than ALPS. The reported G-ALPS slopes were −0.154 for the Alzheimer’s group, −0.077 for mild cognitive impairment and −0.058 for normal controls. The authors describe the relative improvements in slope as 94.81%, 105% and 81.25%, respectively.
These figures describe how the scores changed across repeated measurements in this small group. They do not mean G-ALPS predicted age more accurately, sorted people into clinical categories, or measured the pace of an individual’s future decline. The finding is a pattern in score slopes that would need to hold up in further samples before it could support those uses.
Sleep results were weak in the HCP sample
The HCP data offered a useful counterpoint to the cognitive findings. G-ALPS correlations were numerically stronger than ALPS correlations for both MMSE and the Pittsburgh Sleep Quality Index (PSQI), a sleep-quality questionnaire. But the relationships were weak: for MMSE, the correlation was 0.092 with G-ALPS and 0.076 with ALPS; for PSQI, it was −0.101 and −0.098.
Neither G-ALPS association was statistically significant after correction: the reported adjusted p-values were 0.46 for MMSE and 0.42 for PSQI. The percentage gains—21.27% for MMSE and 2.53% for PSQI—therefore describe small numerical differences between correlations, not evidence of a supported sleep-related association in this sample. The HCP results add little basis for connecting the score to sleep quality.
What the score can and cannot stand for
A diffusion score is not a direct reading of fluid exchange. It is calculated from water movement in selected white-matter regions near the ventricles, where tissue structure can affect the same measurements. The paper notes that degeneration or changes in fiber geometry may alter diffusion. Partial-volume effects, in which a measurement reflects a mixture of neighboring tissues, can also influence directional values.
The index’s anatomical reach is limited to the chosen region and depends on the orientation of nearby fibers. It cannot represent glymphatic activity throughout the brain. Measurement choices such as imaging-plane orientation, gradient directions and echo time can also affect consistency between scans or studies. A higher G-ALPS value may fit the authors’ proposed interpretation of more active exchange, but it remains an indirect reading with several possible influences.
The study’s central contribution is therefore methodological: it offers a revised way to combine diffusion measurements and reports somewhat stronger cognitive correlations in a held-out ADNI sample. Whether those differences are reliable across populations and scanning settings, and whether the score adds information beyond other assessments, remains open.
What a validated MRI measure could make possible
If larger, prospective studies show that G-ALPS is reliable across scanners, reflects change within individuals and adds information beyond cognitive tests, it could eventually help clinicians monitor cognitive decline with a noninvasive scan alongside those tests. This study has not established individual monitoring, better care, or direct measurement of brain waste clearance.
Key Sources
- Primary source: G-ALPS: An index for evaluating cognitive decline and aging using diffusion tensor imaging.
DOI or Journal Page · Peer-Reviewed Paper · 2026-03-01
Keep exploring