
Research Signal – Source date 2022-08-01
A pooled result can make cancer immunotherapy look consistently beneficial, while a closer analysis suggests a more complicated pattern: the overall survival comparison favored treatment, but the short-term disease-control estimate did not show a clear advantage. Those findings can coexist because they describe different parts of the survival curves and use different measures.
A 2022 systematic review and meta-analysis revisited published results from 13 randomized trials of immune checkpoint inhibitors (ICIs) in non-small-cell lung cancer, melanoma, and urothelial cancer. For progression-free survival, the conventional pooled hazard ratio was 0.77. The researchers’ modeled short-term hazard ratio was 1.02, with a 95% confidence interval from 0.84 to 1.24, while the modeled difference in the proportion with long-term progression-free survival was 0.10. The interval around the short-term estimate includes 1, so it does not establish either a short-term benefit or harm across these trials.
These are not three readings of the same patient outcome. They are separate summaries of event patterns over time, estimated using a method designed for trials where treatment effects may not stay constant.
The average can blur the survival pattern
A hazard ratio compares how quickly an event occurs in one trial group relative to another over follow-up. For overall survival, the event is death; for progression-free survival, it is disease progression or death. A ratio below 1 generally favors the treatment group in the comparison. But the familiar Cox proportional hazards analysis is most straightforward to interpret when the relative event rate is reasonably steady over time.
The pooled overall-survival hazard ratio in this reanalysis was 0.75. Read on its own, it suggests a lower event rate over follow-up for patients assigned to an ICI regimen than for those assigned to chemotherapy. The adjusted short-term hazard ratio was 0.86. It still favored the ICI regimen, but less strongly. The model also estimated an 0.08 difference in the proportion achieving long-term survival, equivalent to an eight-percentage-point increment compared with chemotherapy.
Those numbers use different units. The two hazard ratios compare event rates; 0.08 is a modeled difference in the long-term-survival fraction. It does not mean that the analysis identified which individual patients would live longer, nor does it establish that anyone was cured. The authors’ interpretation was that some of the favorable overall hazard ratio could reflect a larger long-term-survivor fraction, while the short-term comparison alone showed a smaller relative advantage.
Early crossings and long tails matter
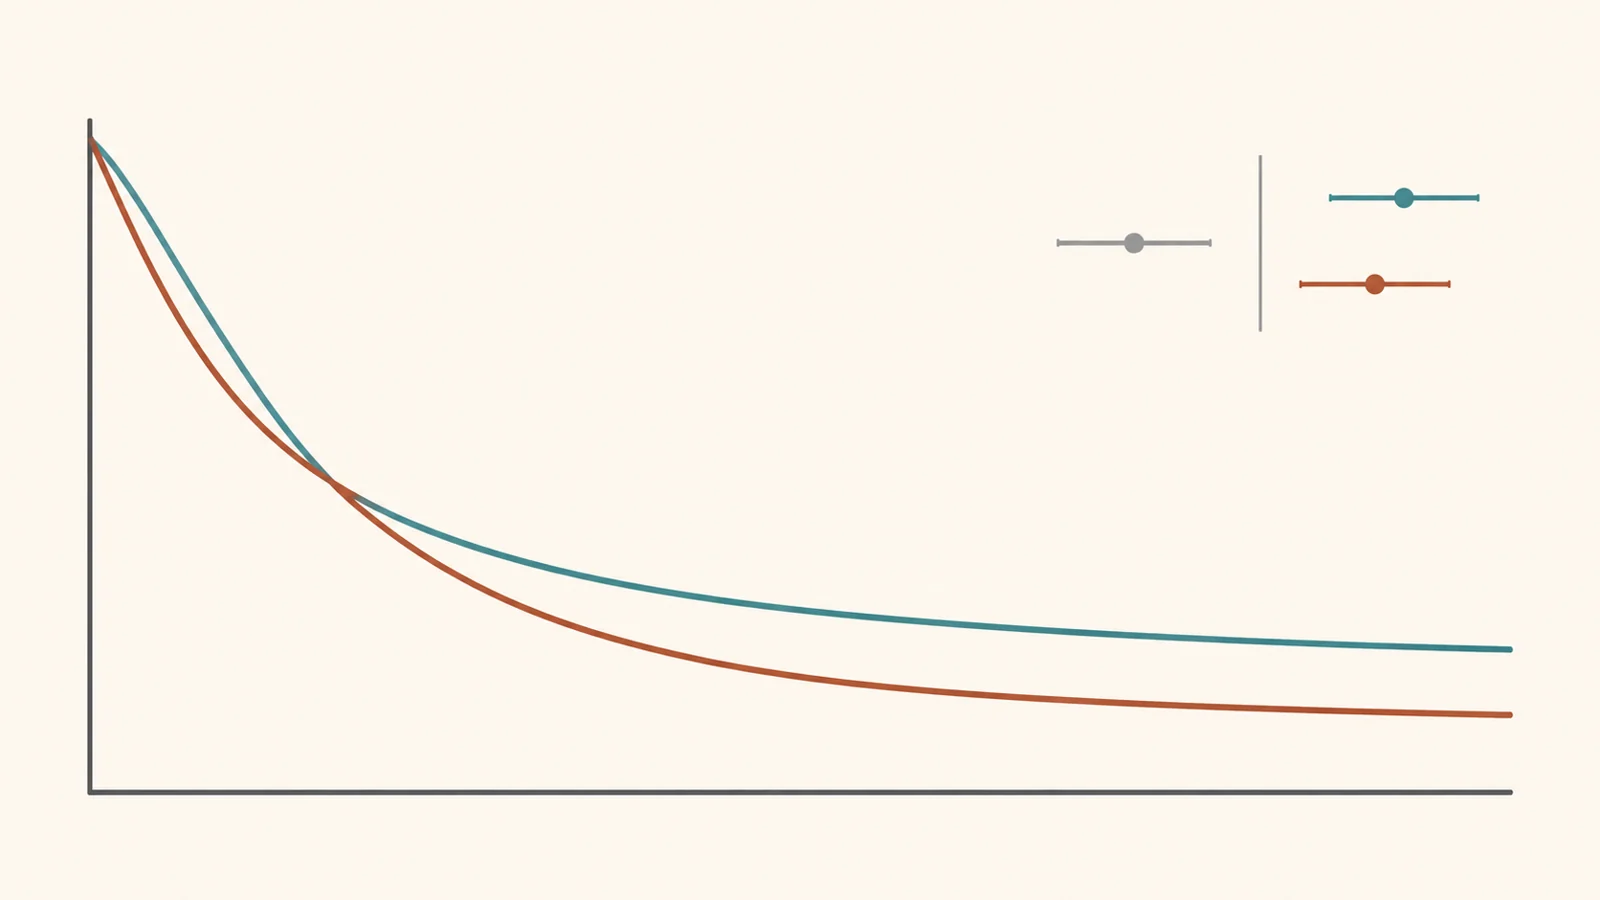
The statistical question comes from the shape of the curves. In some ICI trials, the survival curves cross early: one group can initially have more events, before the pattern changes later. Some curves also develop a long tail, with a portion of patients continuing to survive well into follow-up. If the treatment’s relative effect shifts over time, a single constant-effect summary compresses those changes into one number.
The study’s authors used Cox-TEL, an adjustment that connects the Cox model with a cure-model approach that separates estimated short-term and long-term patterns. Here, “long-term” describes the tail behavior represented in a model; it is not a way to know whether a particular patient belongs in that group or will be cured.
For each trial, the researchers used the published Cox hazard ratio and survival probabilities read from Kaplan–Meier curves, which plot the share of participants who have not yet experienced an event over time. Cox-TEL transformed those inputs into a short-term hazard ratio and a long-term difference in proportions. In practical terms, that difference estimates how much larger the long-term-survival fraction is in the treatment group than in the comparison group.
The analysis therefore reinterprets summaries already published by trial investigators. It does not follow individual patients anew or assign them to a short-term or long-term category. Its estimates depend on the reported ratios and the probabilities reconstructed from the curves.
The progression-free result is a different piece of the picture
The pooled progression-free-survival hazard ratio was 0.77, a conventional comparison favoring ICI regimens. After adjustment, the modeled short-term hazard ratio was 1.02, with a 95% confidence interval of 0.84 to 1.24. Because the interval spans 1, the result is compatible with a range of short-term patterns, including no clear difference. It is not evidence that immunotherapy worsened short-term disease control across the trials.
The estimated long-term difference for progression-free survival was 0.10, or ten percentage points. That is a modeled difference in the long-term fraction, not a probability that any given patient will avoid progression. The adjusted short-term estimate and the long-term difference address distinct parts of the curves, so they do not contradict the conventional pooled ratio. They offer a different way to describe how the aggregate pattern may have formed.
The overall-survival results show a related pattern. When the authors grouped trials by cancer type, the conventional pooled hazard ratios were 0.77 for non-small-cell lung cancer, 0.69 for melanoma, and 0.77 for urothelial cancer. The modeled long-term differences were 0.08 for lung and urothelial cancers and 0.11 for melanoma. These subgroup estimates are based on small sets of trials and should not be used to rank treatments across cancers. They show that the same broad pattern appeared in the selected groups, while the precise estimates varied.
Thirteen selected trials define the reach
The researchers searched PubMed for publications through May 22, 2022. From 1,036 publications identified, they selected 13 phase 3 randomized trials: seven in non-small-cell lung cancer, three in melanoma, and three in urothelial cancer. The trials compared an ICI treatment or ICI-containing regimen with chemotherapy.
Eligibility also depended on whether a trial reported the needed hazard ratio and confidence interval and whether the survival curves met prespecified criteria for a discernible long-term tail. This makes the analysis a focused re-reading of trials with suitable published data, not an estimate for every cancer, immunotherapy, or treatment combination.
Only two trials of ICI combined with chemotherapy met the criteria. That small evidence base limits what the pooled estimates can say about combination therapy. More broadly, the adjustment uses processed published results rather than trial-level patient data. The authors noted that direct analysis of raw patient data under a cure model could provide more informative estimates. Such reanalyses could test whether the separated short-term and long-term patterns hold when calculated from the original observations rather than reconstructed curves.
Where this research could lead
If patient-level analyses in adequately followed trials confirm that the two estimates are stable and useful, future oncology consultations could draw on trial summaries that show early disease-control patterns alongside the chance of durable survival. A patient and clinician could then discuss both parts of the evidence instead of relying mainly on one average hazard ratio. The curves and overall ratios are already available; the possible advance is a dependable, clearly interpreted separation of their time patterns—not a prediction of an individual response. Whether that clearer reporting improves decisions or outcomes remains to be demonstrated.
Key Sources
- Primary source: Analysis of Cancer Survival Associated With Immune Checkpoint Inhibitors After Statistical Adjustment: A Systematic Review and Meta-analyses.
DOI or Journal Page · Review or Meta-Analysis · 2022-08-01
Keep exploring