
Evidence date · 2022-10-01 · Research note 2 of 2
1 2
See current Track status →
Since the previous research note · Earlier expectation not tested
Track continuity
Since the previous research note: What tumor genes may add to PD-L1 testing in gastroesophageal cancer
Previous expectation: Combining tumor genetics with PD-L1 testing might eventually improve checkpoint treatment matching if the genetic patterns proved treatment-specific.
What this study adds: This 2022 synthesis compared PD-L1 scoring approaches and other reported variables across randomized trials, finding different informative PD-L1 readings by tumor type and a strong separate microsatellite-instability signal in adenocarcinoma.
What changed in this study
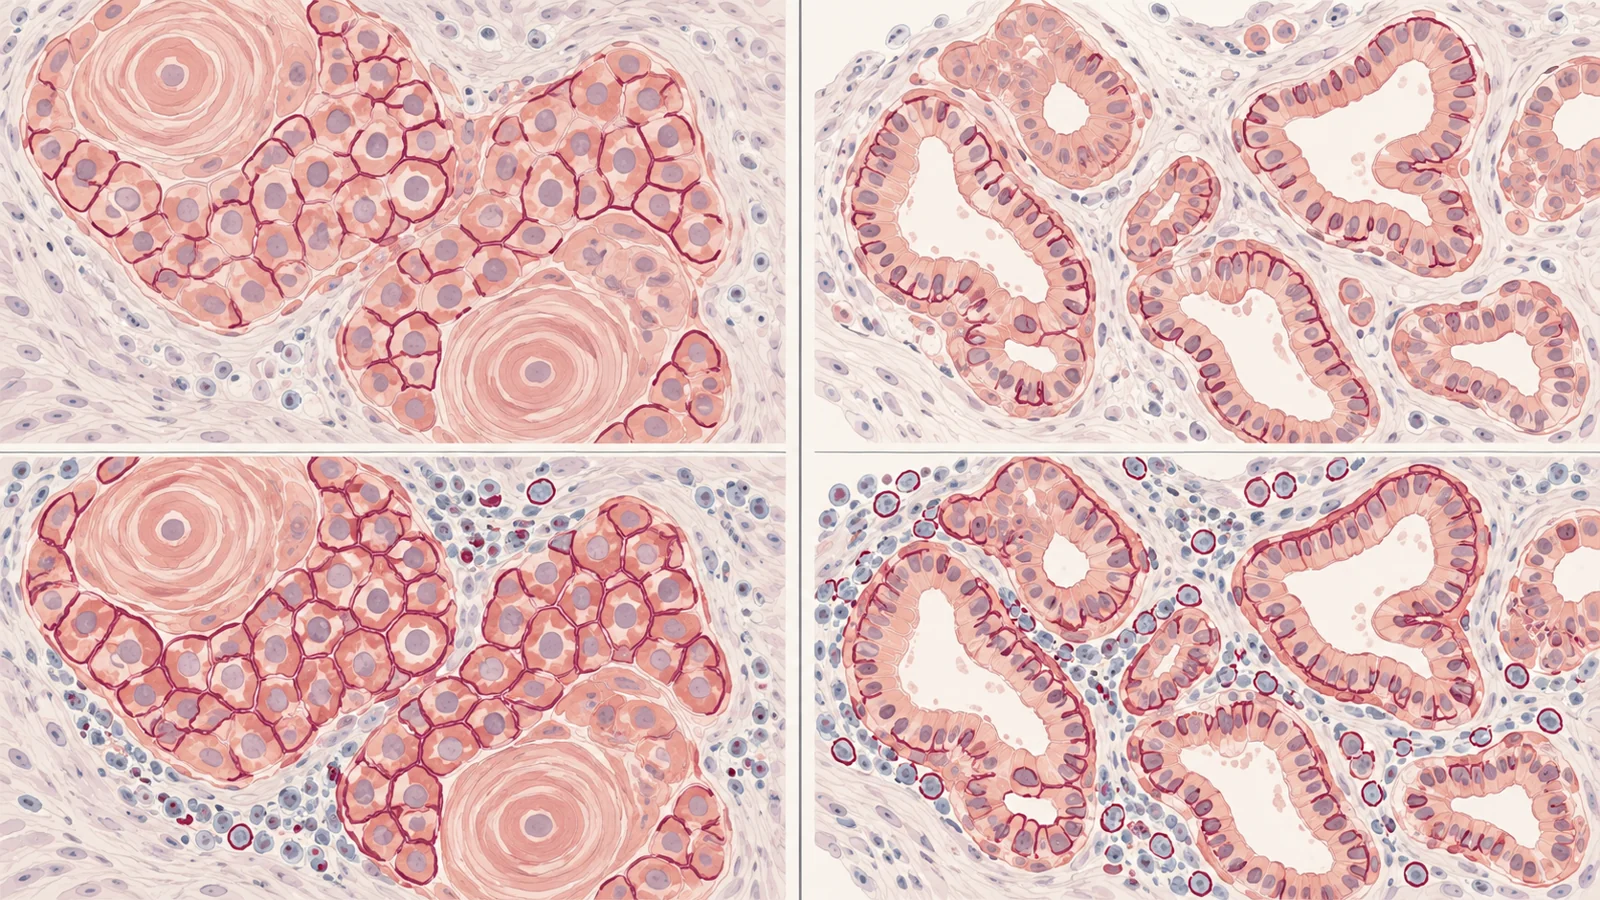
In advanced gastroesophageal cancer, a PD-L1 test could be informative in both major tumor types—but the more useful reading differed. PD-L1 is a protein that can be found on cancer cells and nearby immune cells. In squamous cell cancer, the tumor-cell score tracked differences in benefit from immune checkpoint treatment most strongly among the variables assessed. In adenocarcinoma, a score that counts both tumor and immune cells was more informative, with one separate DNA feature showing an even larger contrast.
That distinction matters because “PD-L1 positive” can describe different measurements. A test result is not a universal forecast: the meaning of a score depends on how it is calculated, the tumor type, and the treatment comparison behind it.
A comparison across 17 randomized trials
The 2022 analysis pooled overall-survival results from 17 phase 3 randomized trials, involving 11,166 adults with advanced gastroesophageal cancer. Nine trials tested treatment in the first line and eight after the first line. Most trials used chemotherapy as the control; the experimental treatment was a checkpoint inhibitor alone or combined with chemotherapy. One trial used placebo as the control. The paper’s search covered studies published through July 27, 2021, and an update in February 2022 found no additional trials to include.
Within each trial, treatment was randomized. The researchers then grouped results by reported characteristics such as tumor type and PD-L1 score, and pooled the treatment-versus-control hazard ratios within those groups. A hazard ratio compares the rate at which an event—in this case, death—occurred over follow-up between treatment groups. Below 1, it favors the checkpoint-containing treatment in that comparison.
The authors also calculated a “predictive value” by comparing the pooled hazard ratios between a variable’s high and low groups. It describes how much the relative treatment effect differed between groups. It is not a person’s chance of surviving, an absolute gain in months, or certainty that someone will respond.
Tumor type itself separated the results. Across the trials, checkpoint treatment was associated with a pooled overall-survival hazard ratio of 0.71 for squamous cell cancer and 0.87 for adenocarcinoma. The difference was modest compared with some biomarker contrasts, but it gave the researchers a reason to analyze the two histologies separately rather than assume one score behaved the same way in both.
In squamous cancer, the tumor-cell score stood out
The tumor proportion score, or TPS, estimates the share of cancer cells that show PD-L1 staining. Among people with squamous cell cancer, the pooled hazard ratio was 0.60 in the TPS-high group and 0.84 in the TPS-low group. The authors’ ratio-based predictive value was 41%, favoring the high-score group. Other assessed variables had predictive values of 16% or less.
For the main comparison, “high” usually meant TPS of at least 1; one trial used a threshold of at least 10. The researchers also examined different TPS thresholds. A score of at least 1 appeared most predictive in that analysis: the pooled hazard ratios were 0.61 above the threshold and 0.89 below it, a predictive value of 47%. At TPS thresholds of 5 or 10, the predictive values were lower, around 24% to 26%.
That threshold comparison rested on data from only four trials. A lower threshold also placed more patients in the high group, so the apparent difference could partly reflect the greater statistical power available for that group. The results offer a comparison within the included trials, not proof of one best cutoff for every test or treatment setting.
In adenocarcinoma, the combined score mattered
The combined positive score, or CPS, counts PD-L1 staining on tumor cells and certain immune cells in relation to the tumor-cell count. In adenocarcinoma, the pooled overall-survival hazard ratio was 0.73 in the CPS-high group and 0.95 in the CPS-low group. That yielded a predictive value of 29.4%; the other variables assessed, apart from microsatellite instability, had values of 12.9% or less.
The CPS-high group was not defined by one consistent threshold across all trials. Depending on the trial, it meant a score of at least 1, 5, or 10. The analysis also found a larger contrast for microsatellite instability-high status, a pattern in tumor DNA that can indicate a different biological feature of the cancer. Its predictive value was 135.8%, based on 153 MSI-high patients across four trials and 1,957 patients without MSI-high status across three trials. The MSI-high group was much smaller, and this finding was distinct from the PD-L1 comparison.
The results do not make PD-L1 or MSI a complete treatment rule. They show how reported subgroups differed in pooled relative survival effects across these trials, where treatment, patient mix, and score definitions varied.
The treatment comparison changed some estimates
A biomarker’s apparent usefulness can shift when the treatment being tested changes. Some trials compared checkpoint treatment alone with chemotherapy, while others added checkpoint treatment to chemotherapy. In squamous cancer, TPS remained the strongest predictor across these treatment designs and in analyses limited to trials that reported results for both score groups.
CPS in adenocarcinoma was less consistent across treatment contrasts. Among trials that reported both CPS groups and compared checkpoint treatment plus chemotherapy with chemotherapy alone, CPS remained the strongest variable after MSI-high. Its predictive value was 18.8%, lower than in trials comparing checkpoint treatment alone with chemotherapy. This matters because the score’s observed separation is tied to the specific treatment comparisons assembled in the analysis; it cannot be detached from them and treated as a fixed property of the test.
The researchers used sensitivity analyses to check whether the patterns persisted when they restricted the included trials by treatment design or to trials reporting both levels of a variable. These checks generally supported the main comparisons, though not every marker behaved uniformly in each subset. Such analyses can test the stability of a pooled pattern, but they cannot remove differences among trials or substitute for randomized assignment to biomarker groups.
A biopsy score is only part of an individual decision
The pooled results can help explain why clinicians may consider both tumor type and the specific PD-L1 scoring method. They cannot tell an individual patient how long they will live or whether treatment will work. The biomarker subgroups were not themselves randomized, and the review did not have individual-patient data. Trial regimens, treatment lines, score cutoffs, and reported variables differed; many possible subgroup comparisons were unavailable or could not be combined consistently.
Testing also has practical limits. Agreement between pathologists can vary, particularly when scoring continuously or assessing immune cells. PD-L1 expression may differ across parts of a tumor and change over time, so one tissue sample may not capture every area or moment. The paper notes that agreement was high at fixed cut points in available gastroesophageal-cancer data, but a measured score still depends on the sample and scoring approach.
The analysis focused on overall survival. It could not robustly combine survival with other decision-relevant factors such as quality of life and treatment toxicities. Those outcomes, along with treatment cost and a patient’s circumstances, matter to the balance of benefit and burden. The finding that low PD-L1 groups had smaller pooled relative benefits does not show that those patients receive no benefit.
How tumor staining could guide immunotherapy choices
Reliable scoring suited to each tumor type could eventually help clinicians identify which patients are more likely to gain from checkpoint treatment, while reducing avoidable exposure to side effects and cost when benefit is uncertain. That capability depends on dependable testing and confirmation that the group-level patterns help guide decisions for individual patients. These pooled comparisons provide a reason to distinguish tumor-cell from combined-cell scoring; they do not validate a rule for withholding treatment based on a low score.
Key Sources
- Primary source: Association of PD-L1 Expression and Other Variables With Benefit From Immune Checkpoint Inhibition in Advanced Gastroesophageal Cancer: Systematic Review and Meta-analysis of 17 Phase 3 Randomized Clinical Trials.
DOI or Journal Page · Review or Meta-Analysis · 2022-10-01