
Research Signal – Source date 2026-03-10
A night without sleep changed two slow brain-imaging measures in younger adults: one reflecting broad fluctuations across the brain, and another describing how those fluctuations lined up with a fluid signal near the cerebellum. In participants aged 40 to 50, the study detected no significant change in either measure after sleep loss.
The difference raises a question about what the measurements mean. The authors suggest the stronger response in younger participants could be a compensatory reaction to acute sleep loss. But the scans tracked patterns in blood-oxygen signals and cerebrospinal fluid movement; they did not measure how much brain waste was removed.
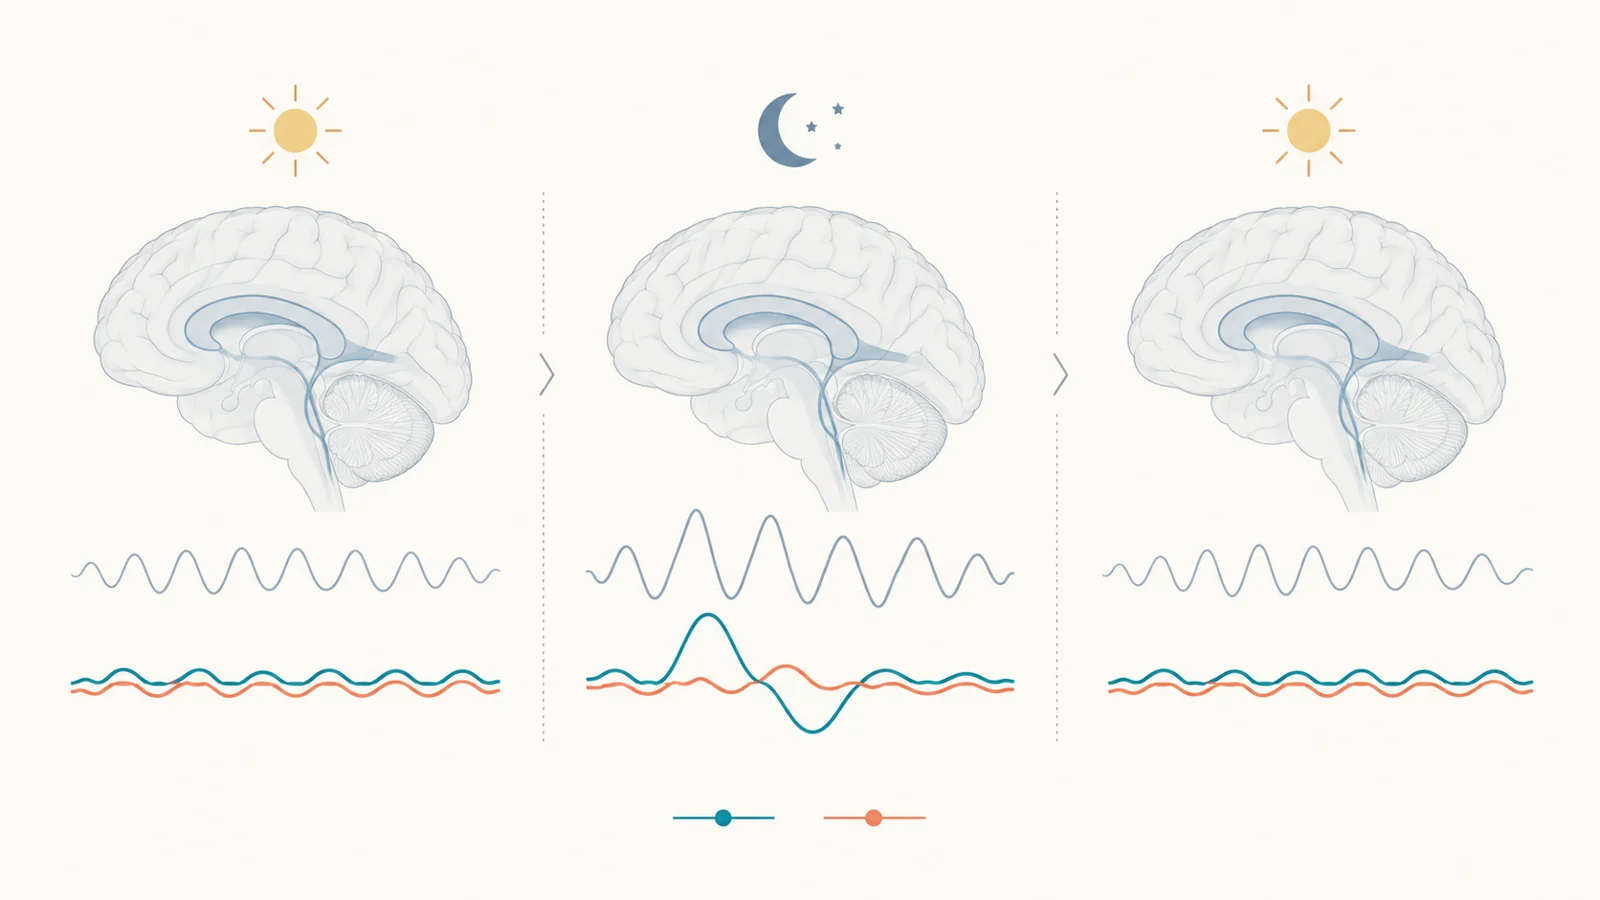
The scans captured a change and its recovery
The controlled laboratory study analyzed 67 healthy adults. Fifty-one took part in a total sleep deprivation schedule, while 16 controls kept an eight-hour time-in-bed schedule over the relevant nights. Everyone first had a night with a nine-hour sleep opportunity to get used to the lab.
Researchers scanned participants on three mornings: after that initial night, after the sleep-deprivation night, and after recovery sleep. The deprivation group had a 12-hour recovery sleep opportunity followed by an eight-hour one before the last scan. This repeated design let the researchers compare each participant’s measurements across conditions. The control group helped show whether changes might instead reflect the passage of time or repeated scanning.
During the deprivation scan, the group that stayed awake showed greater amplitude in its infraslow global brain signal and stronger coupling between that signal and a cerebrospinal fluid signal. Both measures shifted back toward baseline in the recovery scan. The control group showed no significant differences in coupling between its scans.
“Infraslow” here means fluctuations slower than one cycle every ten seconds. To calculate the global signal, researchers averaged resting-state fMRI activity across gray-matter regions and measured how much that average fluctuated. The fluid measure came from an fMRI signal associated with cerebrospinal fluid inflow near the bottom of the cerebellum. Researchers compared the two time series at different offsets, using their correlation at a four-second lag as the coupling measure.
A stronger coupling value in this analysis means the two measured patterns became more synchronized at the specified timing. It is a relationship between imaging signals, not a count of fluid carrying waste out of the brain.
The response differed across the sampled age bands
The researchers divided the 51 sleep-deprived participants into three groups: ages 20 to 30, 30 to 40, and 40 to 50. The first two groups showed significant increases in gBOLD–CSF coupling during sleep deprivation, followed by a return toward baseline after recovery sleep. Their brain-signal amplitude also increased and then moved back after recovery, although the pattern for amplitude in the 30-to-40 group was less consistent at the recovery comparison.
For participants aged 40 to 50, neither coupling nor amplitude changed significantly between the baseline and deprivation scans. The analyses found an age-by-scan interaction for both measures, meaning the pattern across scan conditions differed among the sampled age groups. This supports an age-related difference in the measured response within this sample, not a boundary at a precise birthday. The study also cannot tell us how people older than 50 would respond.
The oldest group included 17 people, compared with 20 in the youngest band and 14 in the middle band. These are modest group sizes, so the result describes the observed sample and its statistical comparisons; it does not establish that every person in one age range responds alike.
The change was stronger in higher-order regions
The study also examined where the global signal appeared across the brain. Researchers compared higher-order networks, including the default mode and frontoparietal networks, with sensory and motor regions. In the 20-to-30 and 30-to-40 groups, the sleep-loss-related increase was greater in higher-order regions. The regional pattern was minimal in the 40-to-50 group.
This analysis describes the distribution of the imaging response. It suggests the change was not spatially uniform, with some networks contributing more than others. It does not provide a second measure of waste clearance or show that a particular region cleared more material.
Baseline sleep measures were linked to later coupling changes
Before the deprivation schedule, participants also had a night of sleep measured with polysomnography. Within the sleep-deprived group, researchers compared those baseline sleep measures with the size of each person’s later imaging change, adjusting for age.
Several indicators of more fragmented sleep were associated with smaller subsequent increases in coupling. These included a higher proportion of time in Stage 1 sleep, more wake time after sleep onset, and more total wake time. The associations describe how individual differences in one baseline night lined up with later changes. They are not the same as the controlled comparison between sleep deprivation and recovery, and they do not show that fragmented sleep caused the smaller response.
A stronger response is not a clearance measurement
The proposed compensatory explanation rests on a distinction between a process and its outcome. The authors interpret the increased global activity and its coupling with the fluid signal as a possible response that could support clearance after acute sleep loss. But neither the gBOLD measure nor the fluid inflow signal directly quantifies the removal of metabolic waste.
A stronger measured response could therefore coexist with impaired overall clearance. The imaging result may reflect a momentary pattern that the authors hypothesize is compensatory, while the net amount of waste removed remains unknown. This study did not establish that the response protects the brain, predicts future dementia, or changes dementia risk. Nor did it test whether changing sleep habits would alter those outcomes.
The controlled schedule, repeated scans, control group, and checks for head motion strengthen confidence that the reported imaging pattern was not simply an obvious motion artifact or a change seen equally in controls. They do not turn an indirect imaging measure into a direct test of clearance. The study’s contribution is a measured age-dependent difference in the brain’s response to a night without sleep, alongside a carefully bounded interpretation of what that response might represent.
What the age difference could mean for brain health
If direct measurements of waste removal and long-term health follow-up establish that this imaging response reflects meaningful protection, the pattern could eventually help identify people more vulnerable to the brain-health effects of disrupted sleep. That use remains hypothetical: this study measured a temporary response to one night awake, not clearance or future dementia risk.
Key Sources
- Primary source: Sleep deprivation exhibits an age-dependent effect on infraslow global brain activity.
DOI or Journal Page · Peer-Reviewed Paper · 2026-03-10
Keep exploring