
Research Signal – Source date 2024-04-15
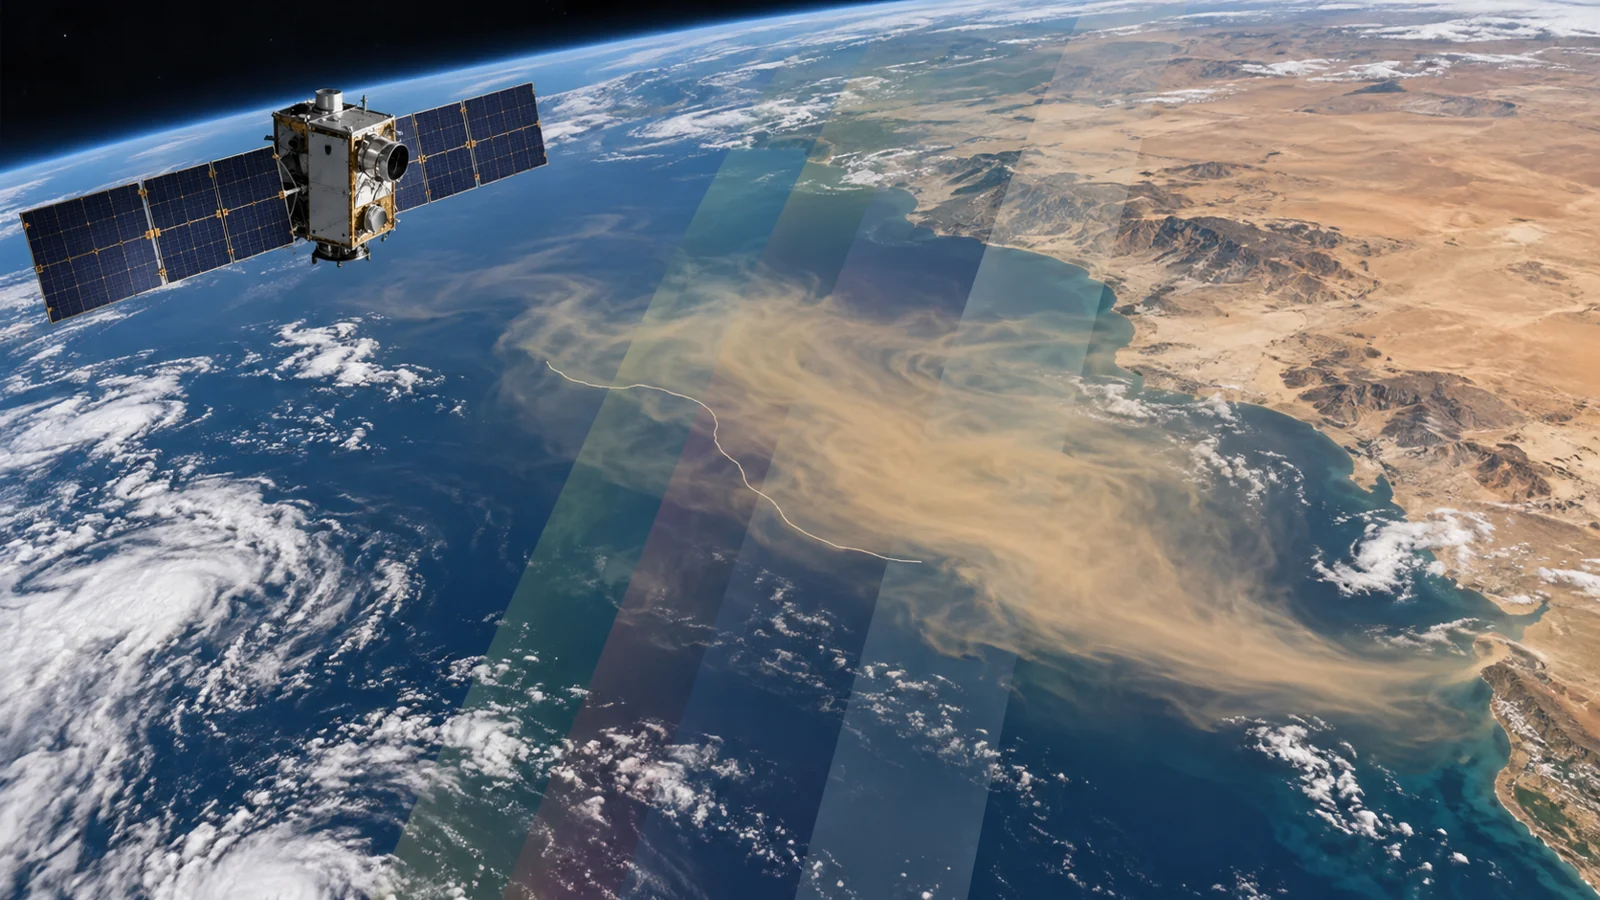
A broad dust plume can look unmistakable in a satellite image. Teaching a computer to recognize dust consistently is harder. It must distinguish airborne particles from clouds and the surface below, including scenes where the differences are subtle. A convincing image and a useful detection result answer different questions.
An arXiv preprint posted on April 15, 2024, brings together research on how satellite observations and machine learning—computer models that learn patterns from satellite data—can tackle this problem. A Review on Machine Learning Algorithms for Dust Aerosol Detection using Satellite Data surveys earlier sensing and modeling approaches. Its contribution is a way to understand the research landscape, rather than evidence of a newly proven monitoring system.
The authors describe useful results from combining measurements across spectral bands and improvements associated with learning algorithms in the studies they discuss. The most revealing thread is how closely those results depend on what the satellite measures, what the model is asked to identify, and how success is counted.
What the satellite can actually see
Satellite data are more than photographs taken from a great height. Multispectral instruments measure radiation in several wavelength ranges, called bands. Different combinations can help distinguish dust from other features in a scene. The preprint presents these combinations as useful both for making dust visible and for quantitative analysis.
One approach compares measurements between bands to emphasize a difference that may be difficult to see in an ordinary color image. A computer can then use those measurements or derived features as inputs. The observation and the algorithm are connected from the start: choosing the bands changes the information available for making a decision.
The paper covers instruments and products with different views of the atmosphere. MODIS, the Moderate Resolution Imaging Spectroradiometer, supplies multispectral observations. CALIPSO, a satellite mission using laser-based lidar measurements, contributes information about the vertical distribution of dust. The review also discusses products from the Ozone Monitoring Instrument, known as OMI, in work involving dust sources and plumes.
These observations serve different purposes. Locating a plume across a broad area, resolving its edges, seeing how it changes over time, and determining where particles sit vertically are distinct tasks. Spatial detail, observation frequency, vertical information, and spectral coverage therefore matter before any model is trained. An algorithm’s name alone tells a reader very little about the detection problem it has actually solved.
How a model turns measurements into a dust label
The reviewed methods approach the problem through different kinds of pattern recognition. A support vector machine learns a boundary between groups of examples. For dust detection, those examples can be represented by combinations of satellite measurements. The boundary separates patterns associated with dust from patterns associated with other classes; mathematical transformations allow more complicated separations than a straight line would permit.
A feed-forward neural network passes inputs through layers of adjustable connections. During training, those connections change so that the outputs better match the examples provided. The review describes networks using band measurements as inputs. Their performance depends partly on choices about the layers and other settings, which researchers test and compare.
Convolutional neural networks apply learned filters to imagery, allowing them to extract image features. This gives researchers another way to work with the information in a scene, beyond supplying a model with a fixed set of measurements for each example. The paper discusses these methods alongside other approaches because dust research includes several related jobs: detection, estimating likelihood, distinguishing aerosol types, and outlining affected regions.
Those jobs produce different outputs. A label that says an image element contains dust is different from a probability score or a boundary around a plume. That distinction helps explain why several model families can be useful without one becoming the universal winner. The useful question is which combination of measurements, representation, and model addresses the particular task.
Why an impressive percentage needs context
The review brings together accuracy, precision, area under a curve, processing time, and root mean squared error. These measures describe different aspects of performance. Accuracy counts the share of classifications that are correct. Precision asks how often a positive identification is correct. An error measure summarizes discrepancies in numerical estimates, while processing time concerns the work needed to produce a result.
Treating those numbers as interchangeable can obscure the problem a study is solving. Even matching metric names do not make results from different datasets a fair contest. The satellite inputs, target classes, test examples, and model settings can all change what a score means.
Cloud confusion is a concrete example. The paper describes support vector results that performed well in low-dust conditions over land and ocean, yet confused many cloudy pixels with dust. It also reports an 84 percent accuracy result for a support vector model in one cited comparison. A reader should not take that percentage to mean that 84 percent of dust events anywhere would be detected. It belongs to a particular classification exercise.
Class balance adds another complication. In one example discussed in the preprint, about 97.5 percent of 75 million feature vectors belonged to the context class. A feature vector is simply a bundle of measurements representing an example. When one class dominates so heavily, an overall score can say more about handling the common class than about recognizing the rare one.
Consider the arithmetic as an illustration, not a reported model result. In a dataset with that balance, a hypothetical classifier that always chose the context class would achieve about 97.5 percent accuracy while failing to identify every other class. That is why the distribution of examples and the kinds of mistakes matter alongside the headline number.
Computational demands introduce a separate practical constraint. The review discusses memory and processing difficulties for support vector methods working with large datasets. A model may classify a selected collection successfully while requiring too much computation for a larger flow of observations. Useful monitoring depends on the combination of discrimination, data availability, and timely processing.
What bringing these studies together adds
The preprint connects choices that are easy to discuss in isolation. Spectral-band combinations supply useful information; models extract or combine patterns; evaluation determines which errors become visible. Seeing those parts together helps explain why progress can come from better inputs and better problem definition as well as a more elaborate algorithm.
Its historical perspective also places learning methods alongside established approaches based on spectral combinations. The authors describe both as productive. That gives the reader a more specific account of progress than a simple story in which newer software automatically replaces older methods.
The comparison remains a synthesis of reported work. Gathering results does not independently verify the underlying experiments or establish that their rankings transfer across regions, sensors, seasons, and atmospheric conditions. Those are substantive limits on how far a reader can carry an individual performance claim.
The authors also point toward further work with deep learning, including attention-based and semi-supervised approaches. These are proposed directions for exploration. Their value would depend on whether they address the recurring difficulties already visible in the reviewed studies, such as distinguishing clouds from dust and handling large, unevenly distributed datasets.
What this could change
If models can maintain useful performance across sensors, regions, and atmospheric conditions while processing sufficiently large streams of observations, satellite monitoring could identify dust sources, plumes, and events faster and more consistently. Turning complex measurements into dependable detections could make it easier for atmospheric researchers to follow where dust appears and how an event develops.
That capability could also contribute to public-health preparedness. More timely information about dust events could become an input to broader assessments of conditions that warrant attention. The path runs from better identification to better situational awareness, with exposure assessment and decisions about protective action requiring additional information and judgment.
The opportunity described by this research is therefore concrete: make satellite observations easier to interpret at a scale and pace useful for following dust. Solving the sensing, classification, and processing bottlenecks together would move that capability closer to routine use.
Key Sources
- Primary source: A Review on Machine Learning Algorithms for Dust Aerosol Detection using Satellite Data
arXiv · Preprint · 2024-04-15
Keep exploring