
Research Signal – Source date 2026-02-10
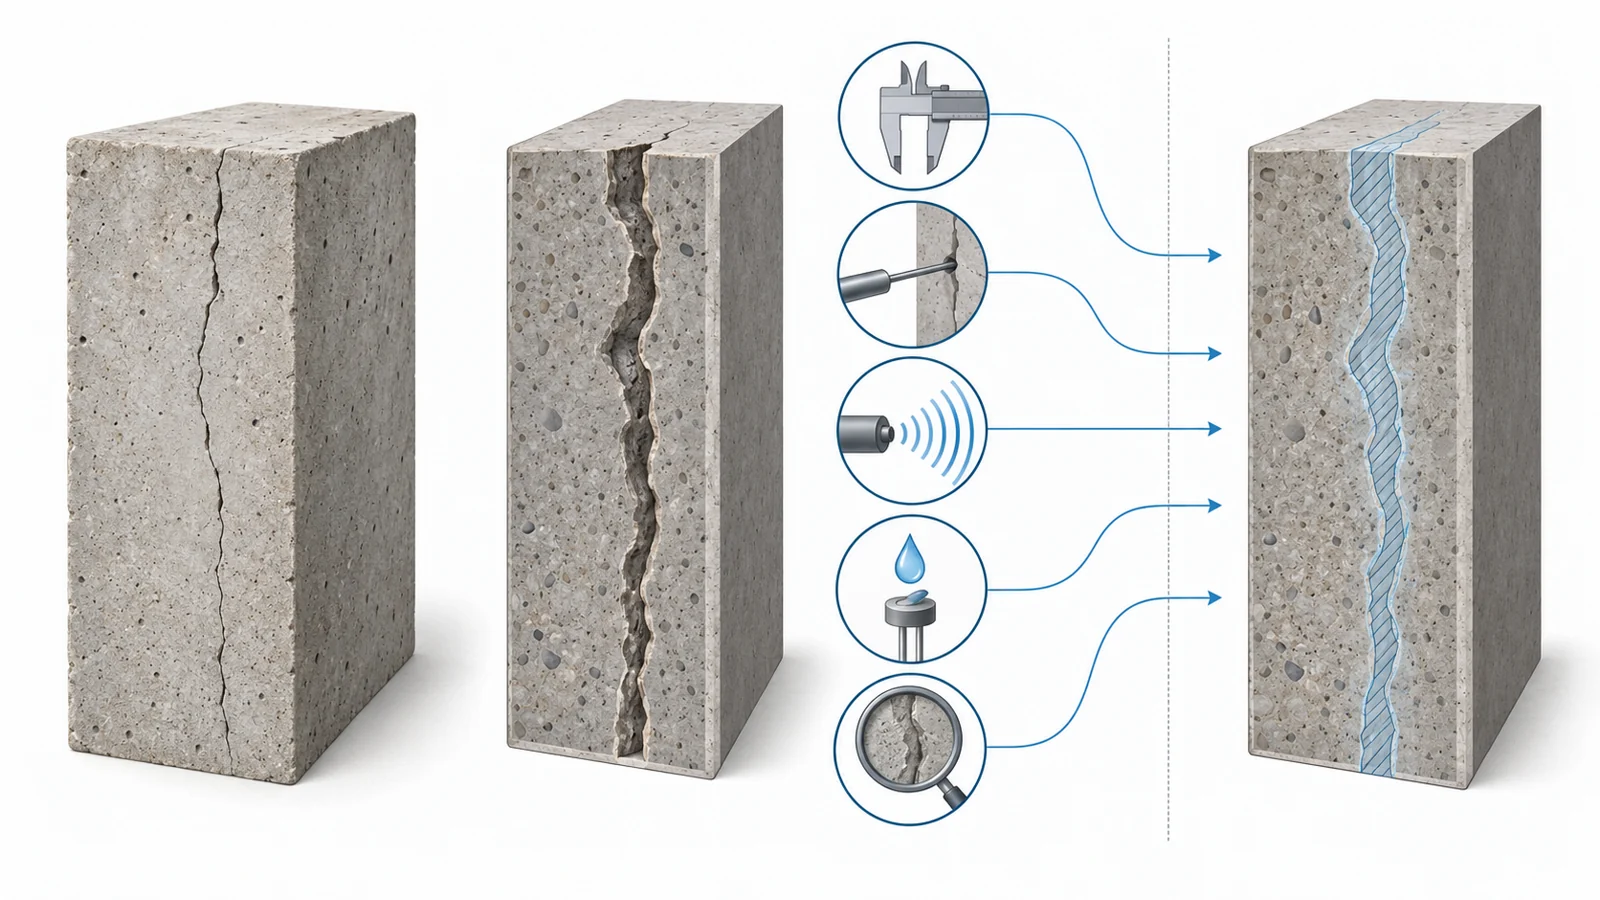
A crack that looks sealed from the outside may still be difficult to assess inside. In self-healing concrete—concrete designed to repair its own cracks—surface closure is visible, but measuring repair across the crack’s interior usually means breaking open a specimen. That makes it hard to follow internal healing repeatedly in the same piece.
A study published on February 10, 2026, tested whether several measurements around a crack could be combined to predict its internal cross-sectional repair. The researchers used laboratory mortar specimens and a statistical model. Their results suggest that measurements can help estimate internal repair under the tested conditions, though prediction was harder early in healing and varied with the model used.
A prediction built from five kinds of measurement
The researchers prepared mortar specimens with cracks targeted at about 1 millimeter wide. The healing agent had a core-shell design that included the bacterium Bacillus mucilaginosus and inorganic components. Specimens were cured through alternating wet and dry phases at 25 ± 2 °C, using artificial seawater prepared to match natural seawater ion concentrations.
The main dataset contained 90 samples: 30 each at 7, 14 and 28 days of curing. For each sample, the researchers measured five indicators: visible surface repair, water-seepage repair, resistivity-based repair, ultrasonic-velocity repair and resistance to chloride penetration. They used these measurements as inputs to predict a sixth quantity, the crack cross-sectional repair rate.
That target represents the estimated share of the crack’s cross-section repaired. It is a repair percentage, not a measure of how quickly repair was changing over time. Measuring the cross-section directly requires destructive testing, so the model’s purpose was to estimate internal repair from other indicators that could be measured on the specimens.
Early healing made the first model harder to trust
Prediction errors depended on curing age. In the first-order model, comparisons at seven days showed a pattern: predictions tended to run high for lower measured values and low for higher ones. One example was a measured value of 52.85 against a prediction of 49.88. The model also had trouble representing the more variable behavior seen early in repair.
Across three cross-validation approaches, the reported root mean square errors fell by roughly 60–70% from seven to 28 days. The authors linked the improvement to the changing state of repair: the early process was more variable, while later measurements were more stable. In practical terms, the input measurements carried a less dependable signal about the internal target at the earliest modeled age.
Simplifying the inputs before adding complexity
Adding more terms to a model can help it represent interactions, but it also asks a small dataset to support more estimates. The researchers found that a second-order model using all five measurements increased cross-validation error, consistent with overfitting risk when each age group had only 30 samples.
They therefore reduced the inputs before rebuilding the second-order model. Sensitivity analysis and a mechanistic review led them to drop resistivity-based repair and ultrasonic velocity, retaining surface repair, seepage repair and chloride resistance. This reduced the number of polynomial basis functions from 21 to 10.
The resulting sensitivity rankings differed by age. At seven days, water-seepage repair remained influential, and its interaction with surface repair also mattered in the reduced model. At 28 days, chloride resistance had a much larger total sensitivity contribution, with a strong modeled interaction between chloride resistance and surface repair. These are rankings within particular model formulations. They do not establish a single causal hierarchy among the physical healing processes.
Matching the model to the measurements’ distributions
The initial polynomial approach used Hermite polynomials, which are suited to Gaussian input distributions. The researchers later built a distribution-aware model using probability distributions estimated from the observed data and custom orthogonal polynomial bases. This allowed the model to better reflect measured inputs that were skewed, peaked or flatter than a Gaussian curve.
For the assessed predictions, this model reported an R² of 0.9816, meaning it accounted for 98.16% of the variation in the measured target values in that analysis. The result was not uniform across values: the model systematically overestimated in the lower-value interval, which contributed 34.2% of the residual sum of squares. A high overall fit can therefore coexist with a meaningful weakness in one part of the data.
Testing predictions at three additional curing ages
The researchers also prepared small groups of specimens at 10, 20 and 30 days, ages outside the original 7-, 14- and 28-day modeling groups. Predictions were compared with measurements from these added specimens. This tests whether the model can make useful estimates at additional points in the curing schedule, rather than only fitting the ages used to build it.
Errors were reported to decline with age. At 10 days, 70% of samples had absolute errors below 1.0. By 30 days, all reported sample errors were below 1.0; examples included errors of 0.33 and 0.26. The added groups were small, with three specimens per age and repeated measurements on each, so they offer a focused check rather than evidence across all ages, materials, crack widths or service conditions.
A separate comparison with published measurements
The paper also compared a first-order model with data from published studies of other healing agents. That analysis reported an R² of 0.7317 and some systematic bias. It used a different model and a different response measure from the distribution-aware model applied to the main experiment, so the two R² values are not a direct head-to-head comparison. The published-data exercise offers a separate indication that the modeling approach may transfer, alongside a reminder that performance can weaken when inputs and materials change.
What better crack predictions could enable
If these predictions hold across broader materials and testing conditions, engineers could have a less destructive way to estimate whether repair extends beneath a crack’s visible surface. That could eventually help compare self-healing mixes and inform decisions about repair strategies in structures exposed to demanding environments. The laboratory mortar results are an early step toward that capability; they do not yet establish reliable service-life or repair decisions for full-scale structures.
Key Sources
- Primary source: Full-cycle prediction of crack healing in self-healing concrete using generalized polynomial chaos expansion.
DOI or Journal Page · Peer-Reviewed Paper · 2026-02-10
Keep exploring