
Research Signal – Source date 2023-10-05
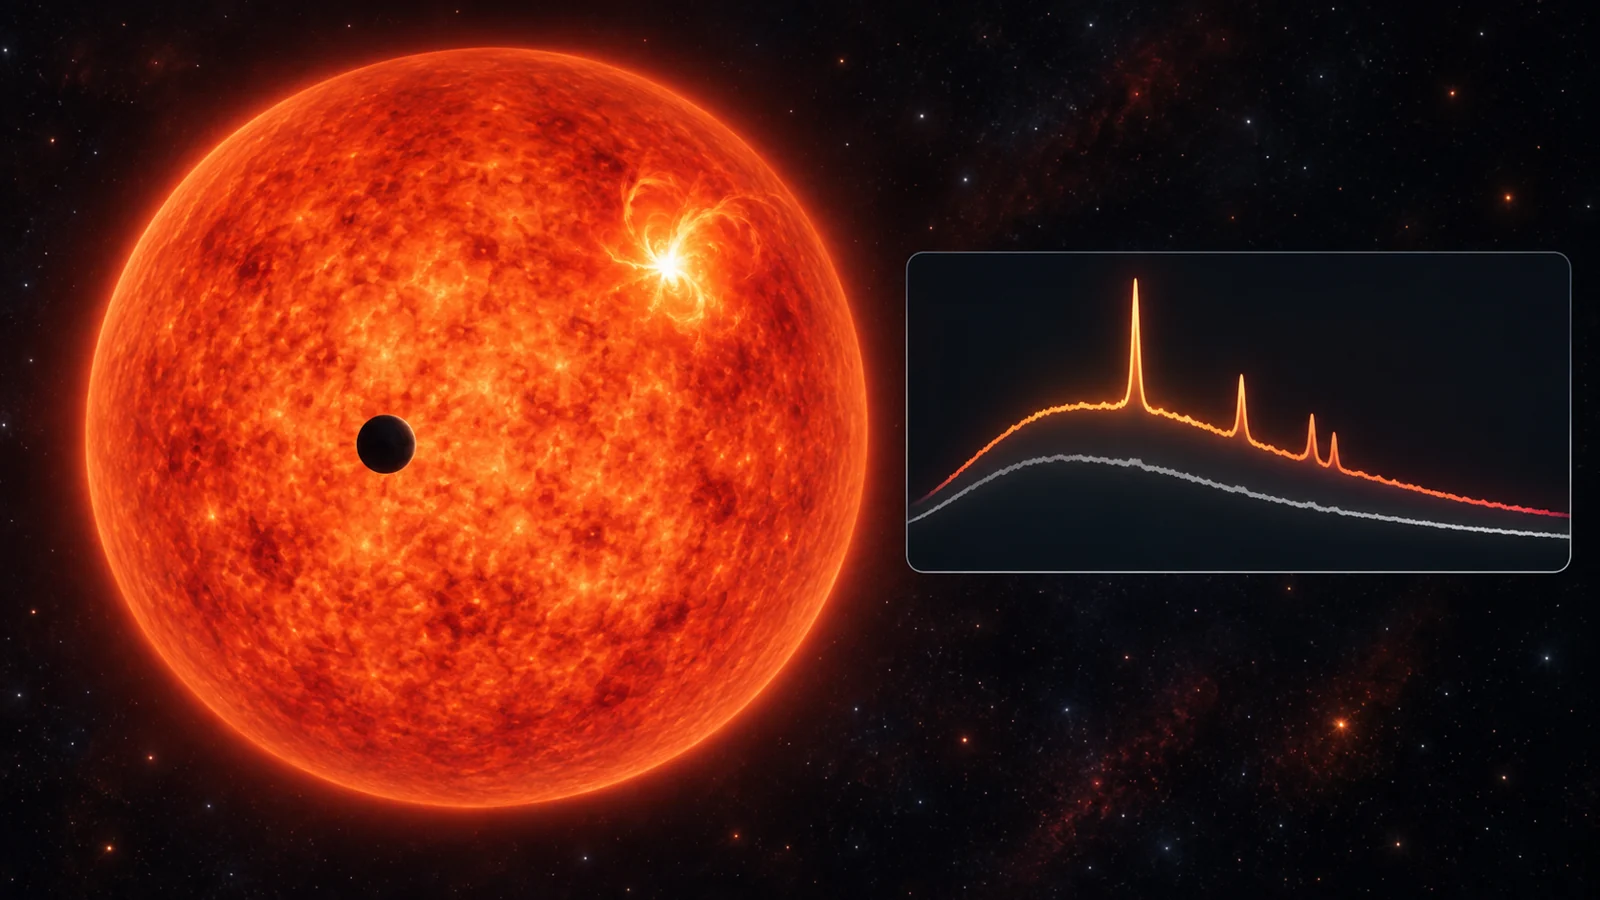
An eruption on a star can brighten the very light astronomers are using to study a planet crossing in front of it. That happened during James Webb Space Telescope observations targeting the rocky planets TRAPPIST-1b, f, and g. An October 5, 2023 preprint examines four captured flares—eruptions on the star—and asks whether measuring their extra infrared light can make affected observations useful again.
The researchers report that much of the flare contribution can be removed in favorable cases. The result offers a way to reconsider observations that stellar activity might otherwise compromise. But a successful correction has to meet a demanding standard before astronomers can use the remaining light to draw conclusions about a planet’s atmosphere.
During a transit, a planet blocks a small fraction of its star’s light. If the planet has an atmosphere, gases can absorb additional light at particular wavelengths, subtly changing the apparent depth of the transit. An evolving flare changes the star’s brightness and spectrum during that measurement. Separating these contributions requires knowing both the color of the added stellar light and how it changes over time.
The eruption has more than one kind of light
Webb’s NIRISS instrument supplied analyzed spectra spanning 0.6–2.8 micrometers, while NIRSpec covered 0.6–3.5 micrometers. These ranges extend from visible red light into the near infrared. The four events were captured in observing visits aimed at planet transits; the two enhancements associated with the TRAPPIST-1g visit occurred just before its second observed transit.
The spectra contain two distinct components. A continuum is a broad glow spread across wavelengths. Emission lines are more concentrated features produced at particular wavelengths by atoms in the emitting material. Measuring both lets researchers examine the overall color of an eruption alongside the behavior of specific atomic transitions.
The authors report Paschen-alpha and Brackett-beta hydrogen emission and characterize the flare continuum between 1 and 3.5 micrometers. Other observed features include additional hydrogen lines and lines from helium and calcium. These measurements extend the description of the eruptions beyond a single brightness curve, showing how different parts of their infrared spectra contribute to the total light.
A bright feature can contain both kinds of emission. For the two NIRSpec events, the authors estimate that hydrogen’s H-alpha line accounts for 61% of the flux in the measured feature, with the underlying continuum contributing 39%. Treating all the brightening there as line emission would therefore mix two physical components. The team used nearby reference light curves to separate the line’s behavior from the changing glow underneath it.
Across all four events, the infrared continua were well described by blackbody fits with effective temperatures below 5,300 kelvin. A blackbody model describes how an ideal thermal emitter distributes its light across wavelengths. Here, its fitted temperature summarizes the color of the measured continuum. It does not assign a single temperature to every part of the flare plasma. The values are lower than temperatures typically inferred from optical flare observations, a comparison that makes the wavelength range and timing of the measurements especially relevant.
A longer exposure can hide the hottest moments
A flare is not a steady lamp. In three of the four events, the fitted temperature was highest near the beginning and then declined. As the emitting plasma cooled, the inferred emitting area expanded. Brightness therefore reflected a combination of temperature and area, rather than temperature alone.
The instruments also sampled the events at different time intervals. The NIRSpec flares initially appeared hotter, but averaging those measurements into 105-second bins produced spectra nearly identical to the NIRISS flare spectra. Combining light collected across an evolving eruption smooths out brief phases. A short, hot interval becomes mixed with cooler emission that follows it.
This provides a concrete reason to be careful when comparing fitted flare temperatures. Differences can reflect how rapidly an instrument samples an event as well as the event’s physical properties. For the fourth flare, combining measurements to strengthen the weak signal made it difficult to compare the time of maximum temperature with the time of peak brightness. The averaging improved visibility while sacrificing some timing information.
How often and how bright are different questions
To estimate how frequently relevant flares occur, the team weighted the 0.6–1 micrometer spectra using the spectral response of TESS, another space telescope. That placed the measured events on a common observing basis. At the reported energy scale of 10³⁰ ergs in the TESS band, the estimated rate was 3.6 flares per day, with an uncertainty of +2.1 and −1.3 per day.
The preprint describes that estimate as approximately ten times earlier predictions based on K2 observations. This is a comparison between estimates derived from different observations, not evidence that TRAPPIST-1’s actual flare activity increased tenfold over time. With four characterized events, the sizable uncertainty is also part of the result. The rate indicates how often observations might encounter relevant eruptions; it does not specify the interference in any particular transit.
For that second question, the paper reports contamination at a wavelength of 2 micrometers of 500 ± 450 parts per million for the TRAPPIST-1b transit and 2,100 ± 400 parts per million for the TRAPPIST-1f transit. Those central values correspond to 0.05% and 0.21%. The uncertainty is nearly as large as the central estimate for b, whereas the extra light is more clearly measured for f.
A fraction of a percent may sound negligible in an ordinary brightness measurement. Transit spectroscopy, however, seeks much smaller differences across wavelengths. The flare rate describes the chance of encountering an event; these contamination measurements describe the scale of the added light during two specific observations. Neither quantity can substitute for the other when assessing an exposure.
Removing most of the extra light
The researchers report removing up to 80% of the flare contamination, with mitigation most effective between 1.0 and 2.4 micrometers. That is the study’s direct practical result for affected transit observations. Characterizing the stellar contribution can make it possible to reduce a substantial part of the interference instead of treating every flare-affected measurement as unusable.
The percentage refers to removal of the interfering flare component. It is not a measure of how much of a planet’s atmosphere has been recovered, nor does it promise an 80% improvement for every observation. “Up to” describes the strongest reported removal, and the wavelength dependence matters. A correction that performs well over one interval need not perform equally well across the full instrument range.
The shape of what remains matters alongside its size. A residual that changes with wavelength can affect the same comparison used to search for atmospheric absorption. A useful correction must therefore preserve the small differences associated with the transit while bringing the stellar contribution under sufficient control. A visibly cleaner light curve alone does not settle that question.
The precision gap between a flare and an atmosphere
The paper includes checks that help locate the measurement uncertainties. Two reductions of the NIRISS data produced qualitatively similar flare light curves at representative wavelengths. The authors found one reduction, supreme-SPOON, better optimized for flare photometry based on its point-to-point variability. Agreement between reductions supports the broad appearance of the events, while differences in scatter affect how finely their behavior can be measured.
Calibration also influenced the inferred physical properties. When the team used an alternative flux calibration, the mean shifts in fitted temperature near the flare peaks ranged from 20 to 860 kelvin across the four events. The shifts were smaller away from the peaks. This shows that a fitted temperature depends partly on how the instrument measurements are converted into calibrated light levels, with some events more sensitive to that choice than others.
The distinction becomes sharper when comparing the scale of stellar and planetary measurements. The authors discuss flare signals of roughly 1,000–10,000 parts per million alongside planetary signals around 100 parts per million. Uncertainty in the precise shape of the underlying transit can have a relatively small effect on the characterization of a prominent flare while still mattering greatly for a much weaker planetary feature.
That is why identifying hydrogen emission, fitting the continuum, and reducing the extra light do not by themselves establish an atmosphere or an atmospheric molecule. The atmospheric interpretation requires accuracy at the smaller planetary scale, including control of residual stellar structure and measurement errors. The four-event study demonstrates a bounded correction result for these observations; it does not establish a universal solution for other stars, other flares, or slowly varying starspots.
What this could change
From the October 2023 perspective, the potential gain is a larger pool of usable transit observations for studying rocky planets. If flare corrections can control residual stellar interference at the scale of the planetary features being sought, astronomers could retain measurements that would otherwise contribute little to atmospheric constraints. More usable transits would provide additional opportunities to measure weak wavelength-dependent differences and assess whether they recur.
The same visits would then serve two connected purposes. Their unplanned stellar eruptions would supply empirical measurements of infrared flare behavior, and sufficiently accurate corrections could let their intended planetary observations contribute to atmospheric studies. The downstream benefit depends on crossing that precision gap, so the value of the work lies in opening a route toward better use of scarce observing time without treating flare removal as an atmospheric discovery.
Key Sources
- Primary source: Characterizing the Near-infrared Spectra of Flares from TRAPPIST-1 During JWST Transit Spectroscopy Observations
arXiv · Preprint · 2023-10-05
Keep exploring